
Help and the inspector
Completion, quick doc, jump to definition, rename, the command palette, and the value inspector.
Help
Completion, quick documentation, jump to definition and rename all resolve in the namespace your program runs in, so a function Run just defined shows up like a core one. The right-click menu and command palette reach them too.
Ctrl+Space, Ctrl+Q and Ctrl+B mean Control specifically, even on a Mac. The F-keys take no Control or Command (most Mac keyboards need Fn). What each runtime supports is in Known limits.
Completion
Ctrl+Space, in the editor or the console's input line, opens a popup of candidates with a doc preview. One match is inserted straight away.
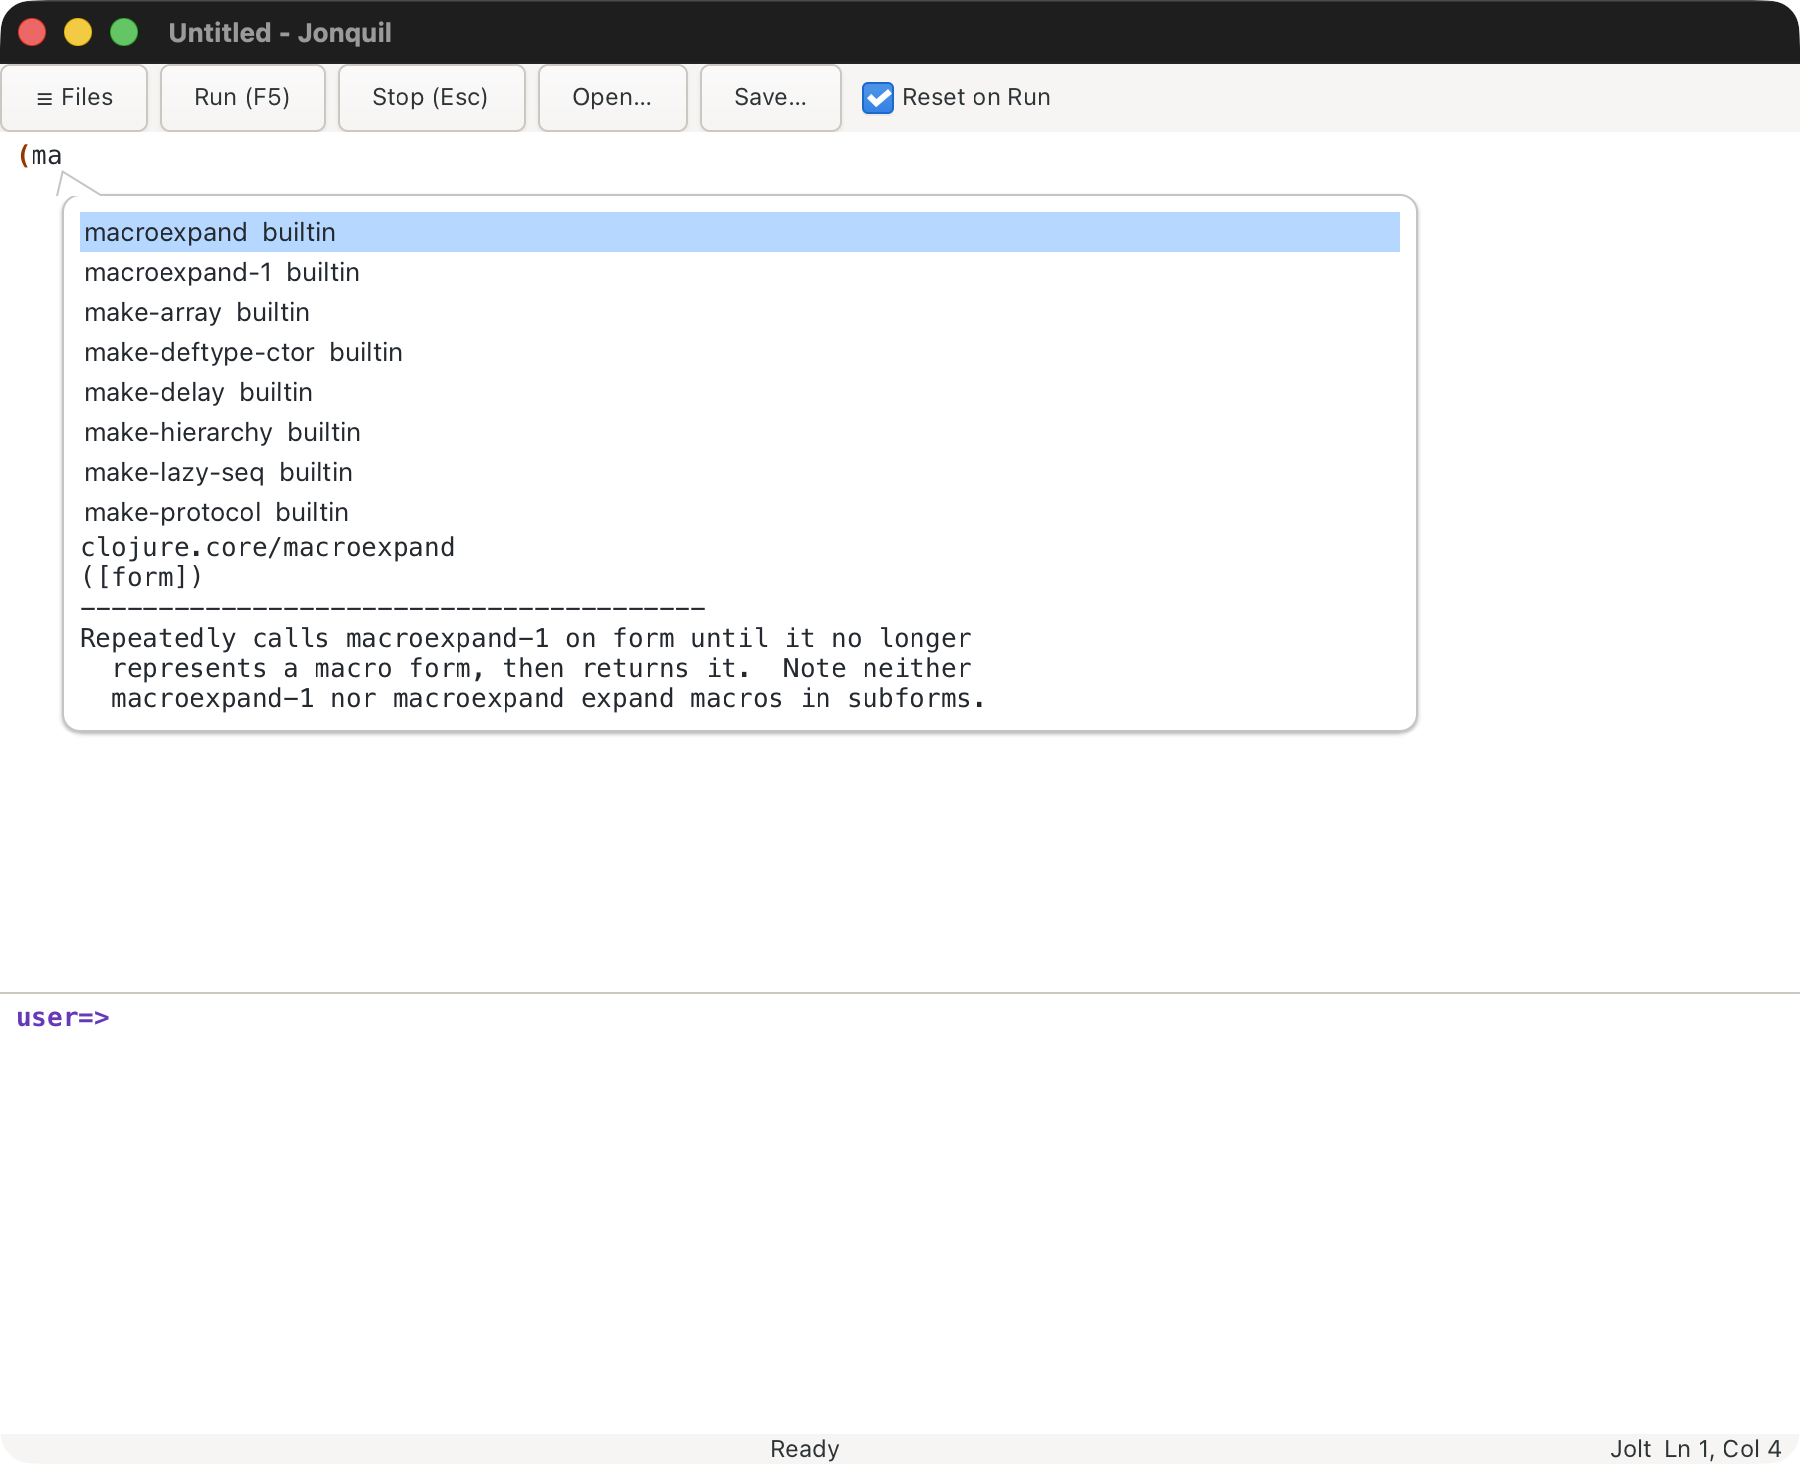
- Up and Down move one row, PageUp and PageDown eight.
- Enter or Tab commits; Escape closes without changing the buffer.
- In the console, Up/Down and Enter belong to the popup while it's open, not to history or evaluation.
Candidates come from special forms, built-ins, the file's own definitions, and whatever your program has defined. Each row is tagged with its source (special, builtin, buffer, user, and for ClojureScript core or remote). When a server answers completion, its names join the list as they arrive.
Quick documentation
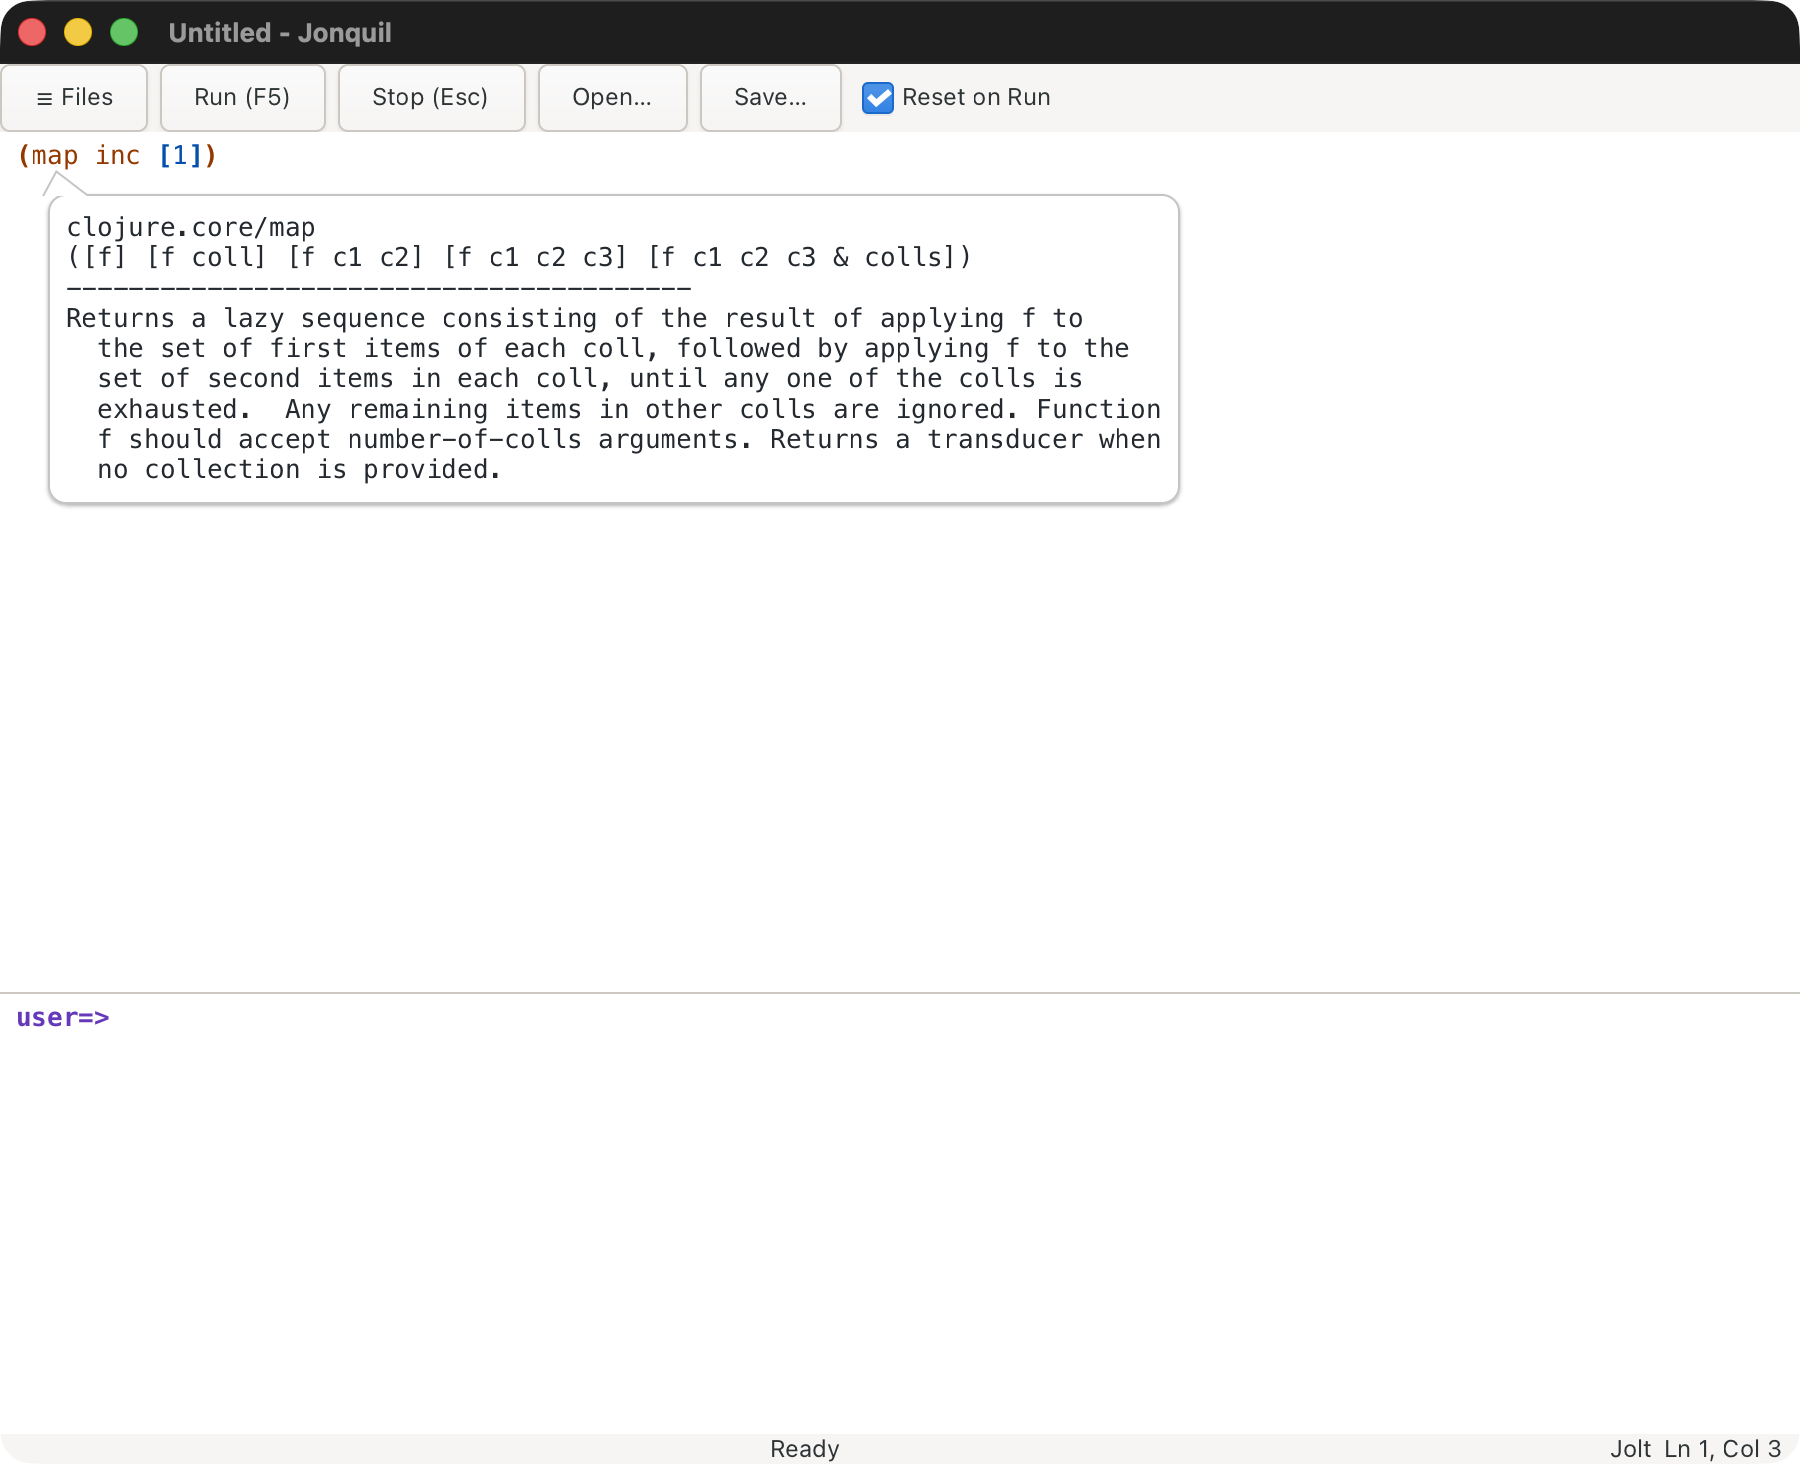
Ctrl+Q or Shift+F1 shows the namespace, arglists and docstring for the symbol at the caret. Escape or moving the caret closes it.
The docs panel
The popovers close as soon as you type, so they can't stay beside the code. Show the documentation in a panel, in the palette or on Cmd/Ctrl+Alt+9, puts the doc of the symbol at the caret in a panel on the right, where it stays while you keep working. It asks the way full doc does: a dialect with a full doc answers with that (JVM Clojure's includes ClojureDocs examples, each with Run in Interactions and Copy to Definitions), and Jolt and ClojureDart show the quick doc text. (Cmd/Ctrl+Alt+D would be easier to remember, but macOS takes Cmd+Option+D to hide the Dock.) With no symbol at the caret the command just brings the panel back and focuses it.
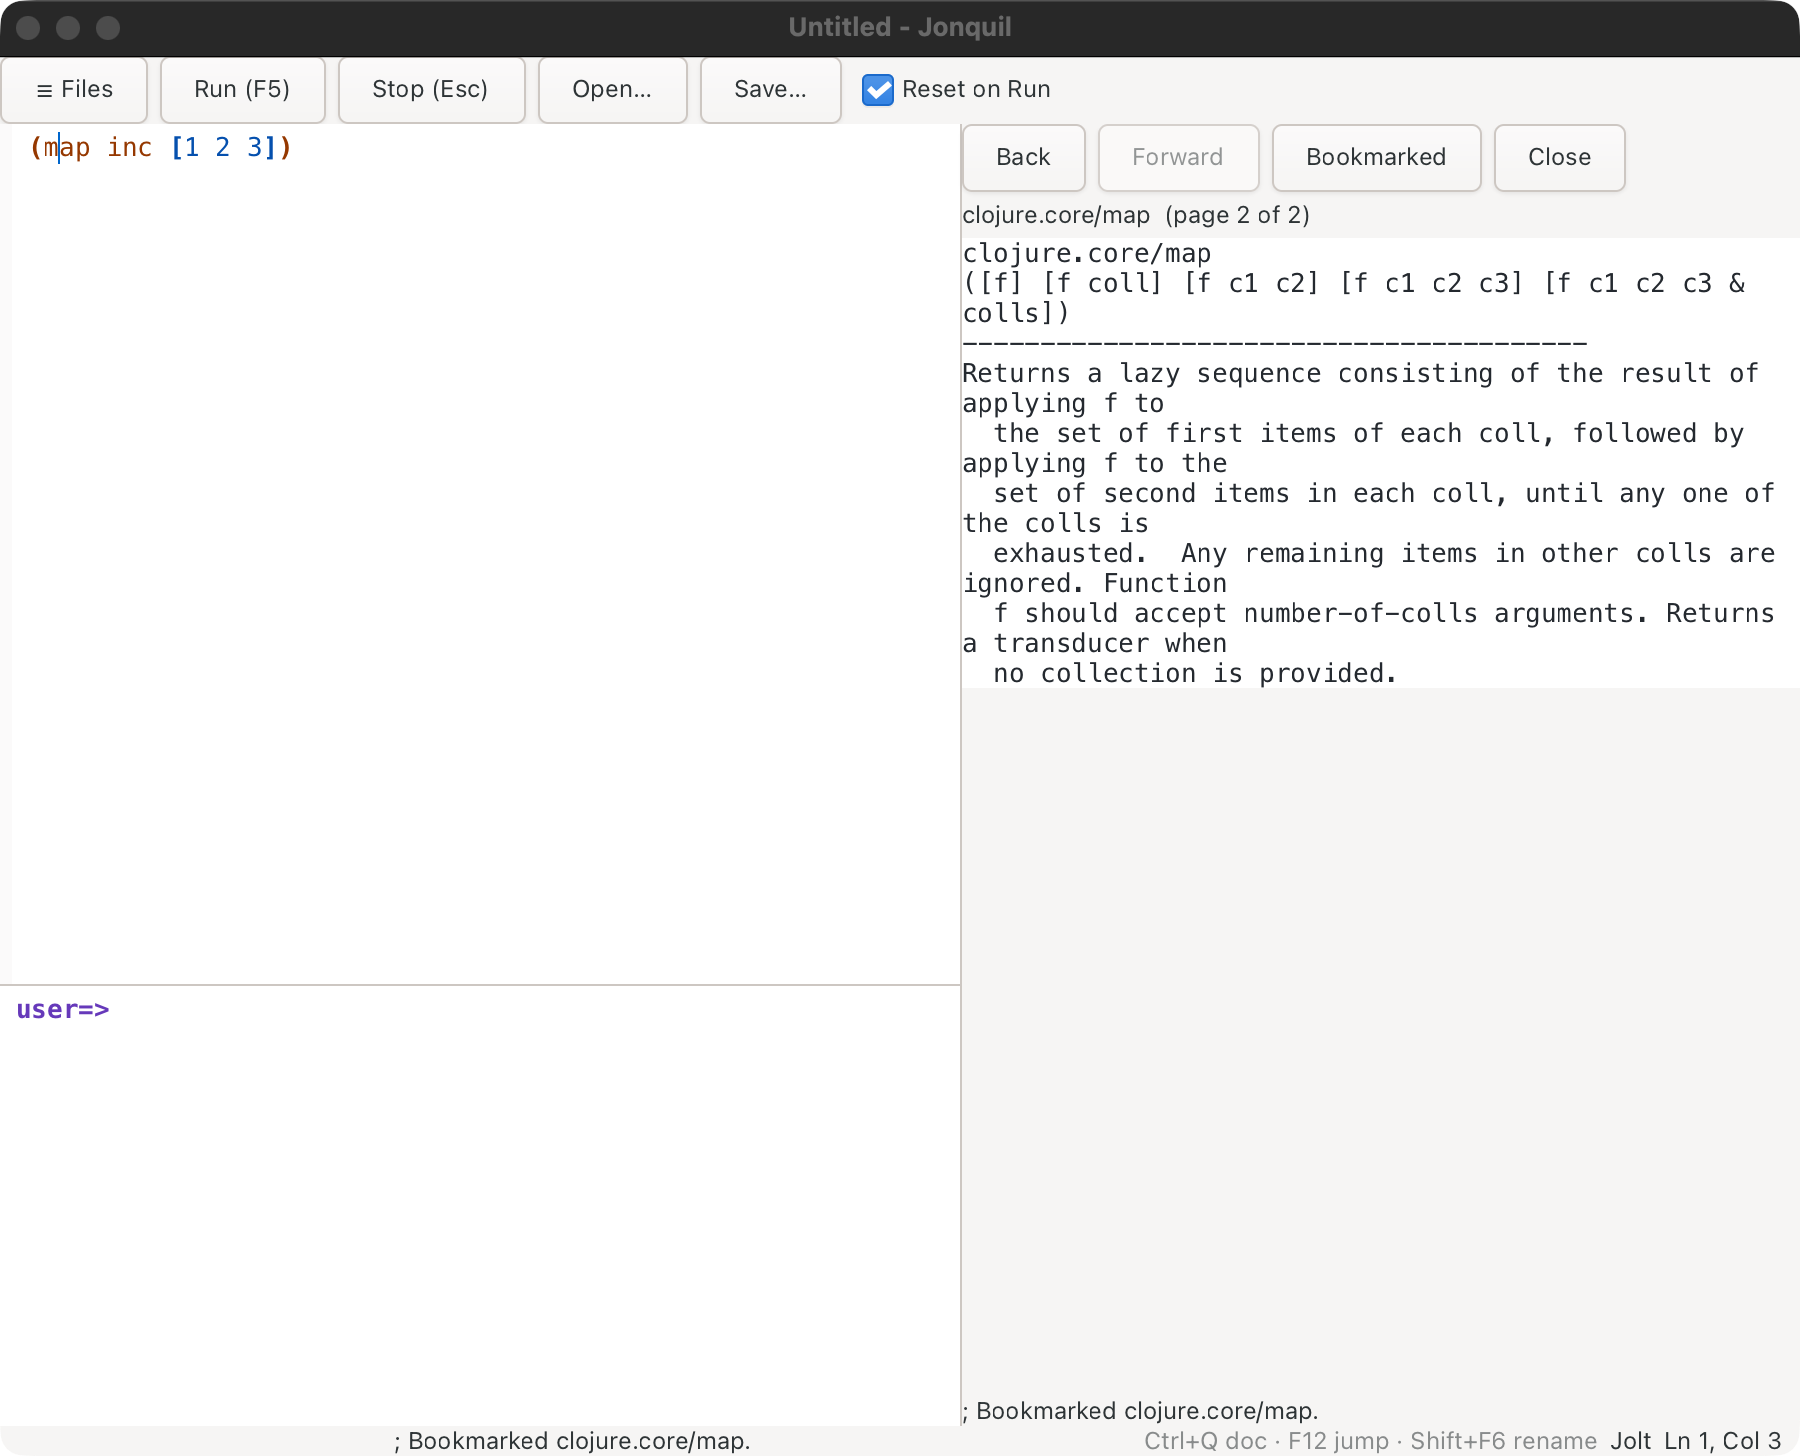
- Following a symbol. Click a symbol in the page and its doc becomes the next page. A symbol with no docs says so on the panel's footer and leaves the page as it was, and a drag that selects text isn't a click. The click waits out the double-click time, so a double-click that selects a word follows nothing. Guide pages work the same way.
- History. Back and Forward, or
[and]while the panel has focus, move through the last 50 pages. Opening a doc after going back drops the pages that were ahead, as a browser does. Back and Forward show a page as it read when you first opened it, so Show the documentation in a panel on the same symbol asks again when you want a fresh one. - Bookmarks. The Bookmark button, or Bookmark This Page in the palette, saves the page you're reading, and pressing it on a bookmarked page removes the bookmark. They live in the settings file under
:doc-bookmarks, so every window and the next start have them. Open a Bookmarked Page… lists them in the palette and picking one opens it. A symbol is kept under the qualified name full doc gave (clojure.core/map), or as you typed it when the dialect has no full doc, and is looked up again from the tab you're in. If you edit:doc-bookmarksby hand into something Jonquil can't read whole (an entry that isn't a page, say), Bookmark and the bookmark list leave the file alone and say why on the panel's footer. - Guide pages. Open a Guide Page… lists the pages of
docs/guidebeside the Jonquil source tree that is running. A page shows as plain text: headings underlined, links as their words, code indented. The installed app is one compiled file with no source tree, so there the command says the guide isn't installed.
Switch to panel: Reader brings the panel back once you've had it open.
Jump to definition
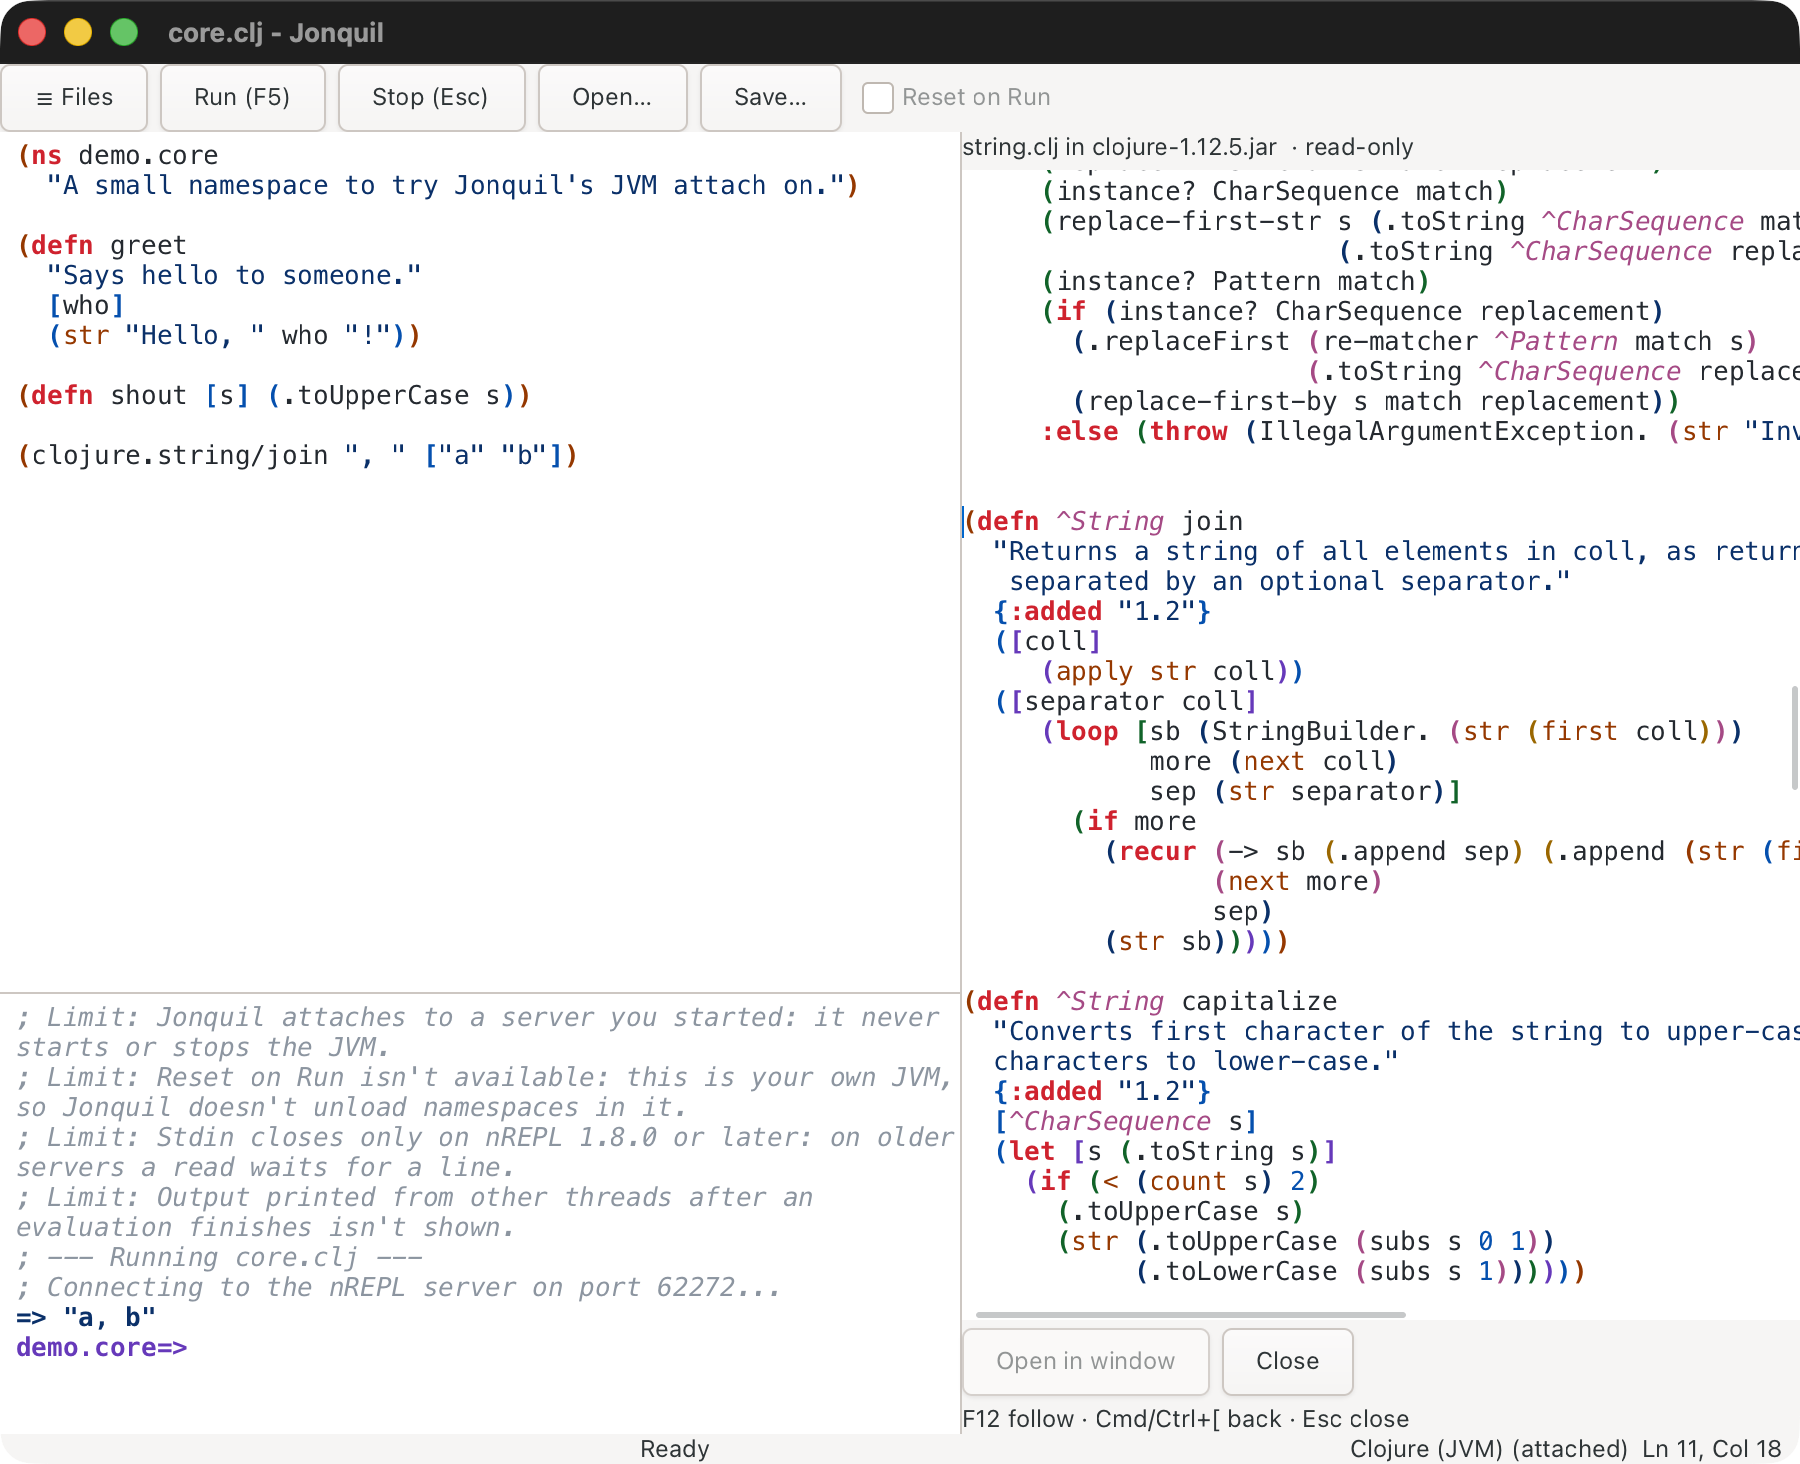
F12 or Ctrl+B jumps to the symbol's definition: the nearest local binding, then a top-level def or defn in the file, then another file if the runtime can say where it lives.
- A file in your project opens in a tab; Cmd/Ctrl+[ goes back.
- Library code and files outside the project open in a read-only source panel on the right. In it, F12 follows definitions, Cmd/Ctrl+[ goes back, Escape closes it and Cmd/Ctrl+I swaps it for the inspector.
- Where a runtime can't say (or for built-ins), you get the var's documentation instead.
Rename
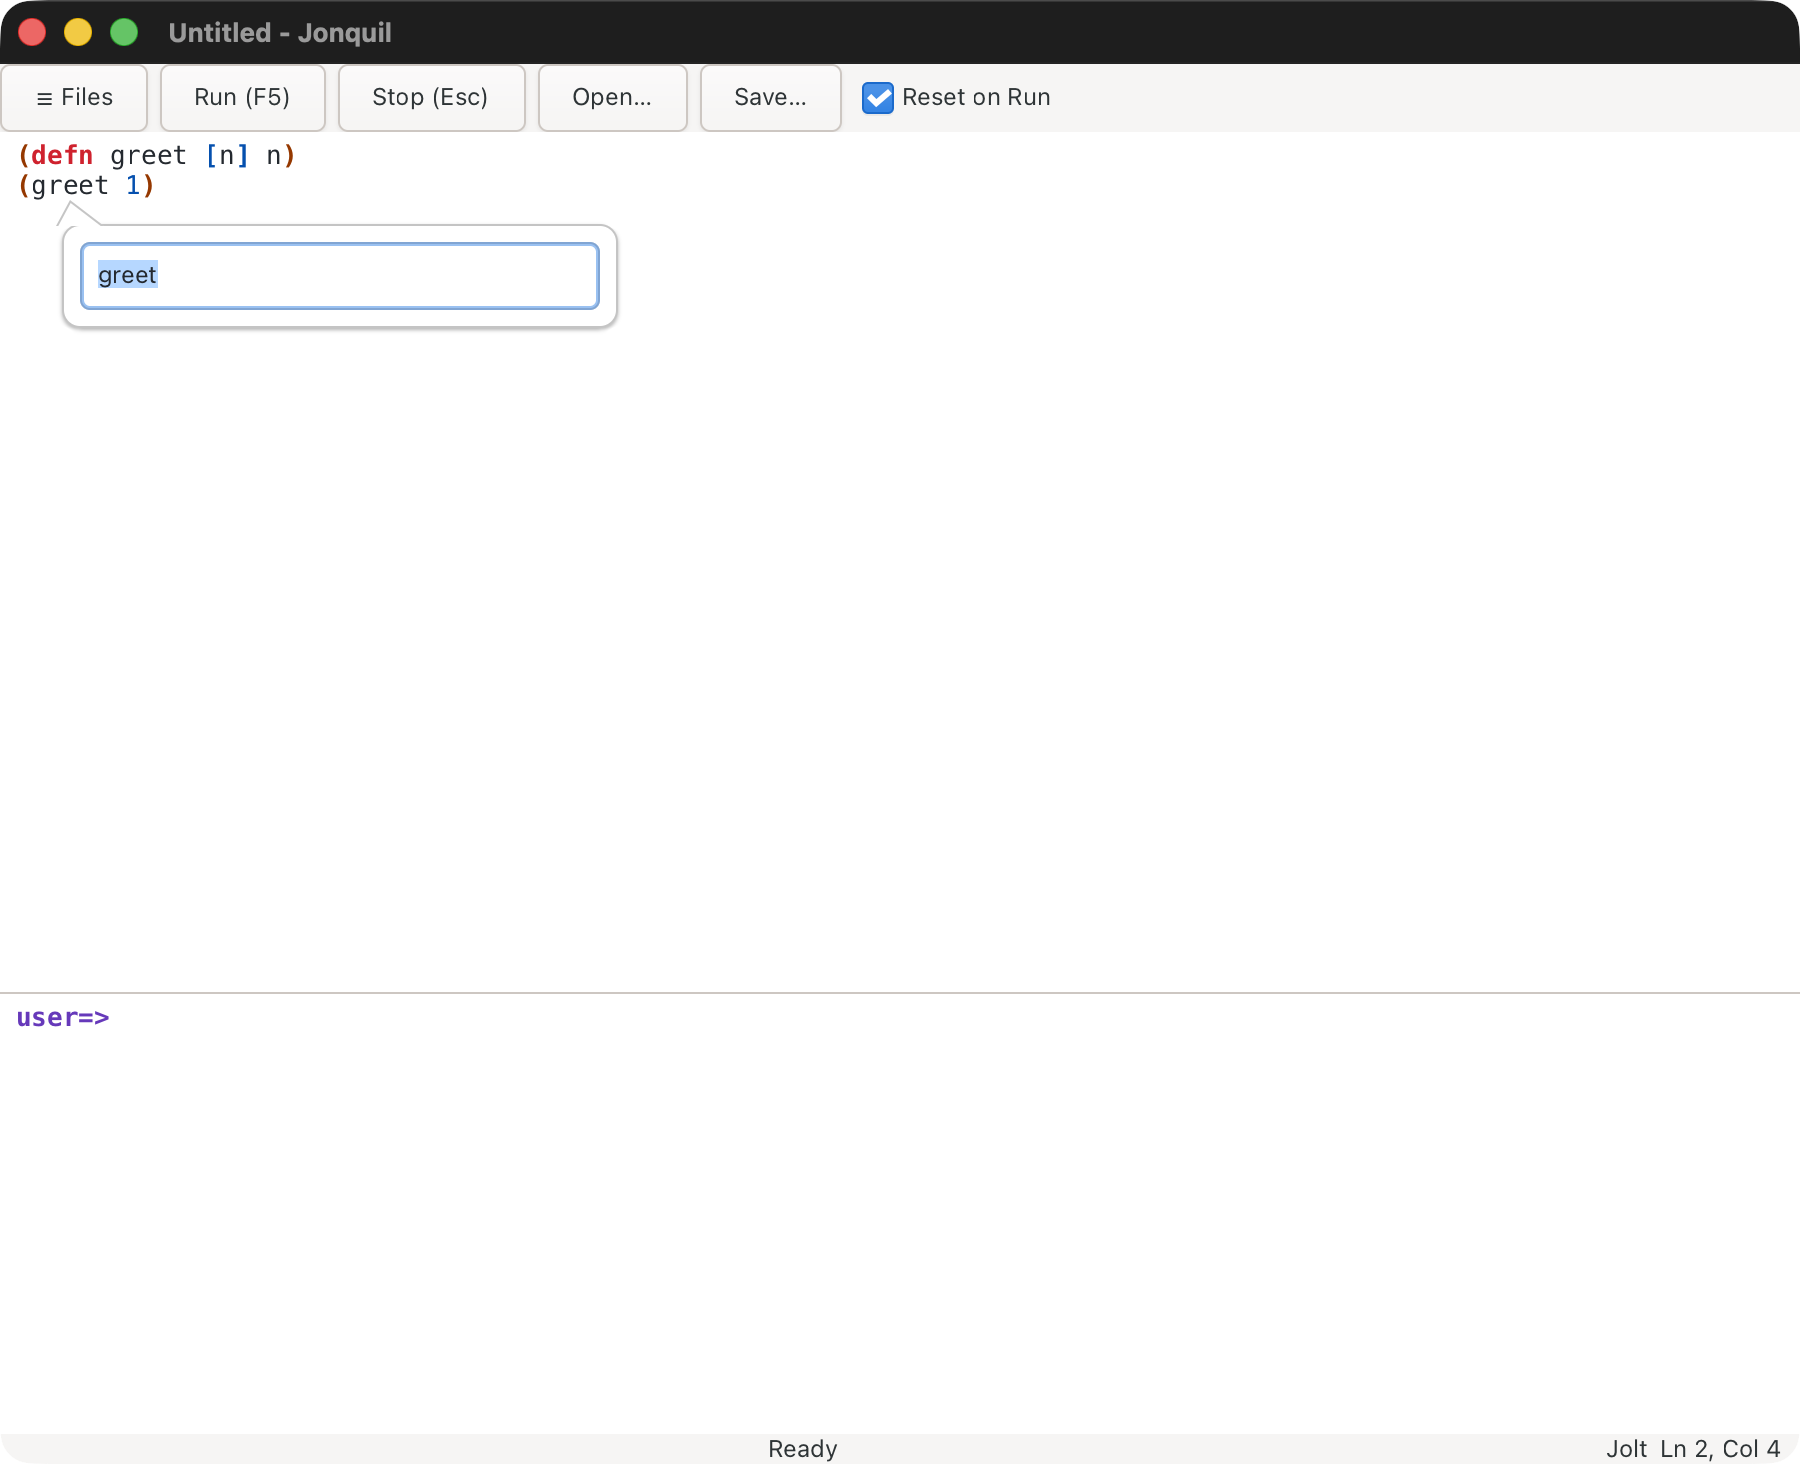
Shift+F6 or F2 opens a popup prefilled with the symbol. Enter applies, Escape cancels. Only code changes: exact symbol tokens, never comments, strings, regexes, keywords or longer names (renaming greet leaves greeting). A blank or invalid name is explained in the popup. A rename is one undo step.
Right-click menus
Shift+F10 or a right click over the editor opens a menu with Run Form, Jump to Definition, Rename Symbol, Quick Documentation, Inspect Last Result, Inspect Form, Complete and the editing commands. Each runs the same function as its key.
The command palette
Cmd/Ctrl+Shift+P lists Jonquil's commands, with their keys and source (built-in or plugin). Type words to narrow by description or id, Up and Down to move, Return or a click to run, Escape to close.
The same words work at the Interactions prompt after a !, so you can run a command without leaving the keyboard's place: !clear the console and Return runs it, and the console names what ran. Words that match several commands list them and run none, and a command whose description is exactly the words wins over the longer ones. The line goes into the history like any other, so Up brings it back. Only one line of words counts, with a space somewhere after the !: a single word after it is read as code, since !x and != are Clojure symbols, so type ! clear for a one-word command. A line with brackets or quotes, or more than one line, always goes to the evaluator.
Switching panels
The panels on the right share one place, so opening one hides the one that was there. The palette lists Switch to panel: name for each panel you've had open in this window, the one you saw last first, leaving out the one on screen. Cmd/Ctrl+Alt+1 to 8 each go to one panel: 1 the Inspector, 2 Source, 3 Locations, 4 Frames, 5 Trace, 6 Plugins, 7 Messages and 8 Processes (Cmd/Ctrl+Alt+9 shows a doc in the docs panel). Both focus the panel when it's showing. Otherwise Frames, Trace and Plugins open the way their own commands do, asking for the last error, the recorded calls or the plugin list as they are now. The Inspector, Source and Locations come back with what they showed when it still holds. Until something fills them, their keys say on the status bar what does. Switching to another dialect empties the Inspector and Source, and closing the tab a locations list came from clears that list, so those leave the palette's list too. A plugin's history and an agent's proposal aren't offered, since each belongs to the plugin or proposal it was opened from.
Layouts
Save the layout, in the palette, keeps the window's arrangement as it is: whether the file tree shows and how wide, which right-hand panel shows, and where the editor and console split. The panel opens at its usual width. It's named after what shows, such as File tree and Trace panel or Editor only, so saving again with the same parts showing replaces it. The palette then lists Use layout: name for each one, which shows or hides the tree, opens the panel the way its key does and sets the tree's width and the split. A panel with nothing to show yet says so instead. Forget every saved layout clears them. Layouts live in the settings file, so every window and the next start see them.
Messages
The Messages panel keeps a log of what happened in the background while you were looking elsewhere, newest at the top. Every MCP tool call an agent makes gets a row naming the agent by the name its client sends, so a jonquil_replace_text from Claude Code reads "Claude Code replaced the text of core.clj". When an open tab's file changes on disk, there's a row for that too. That's the case to watch for, because agents usually edit files with their own tools, which Jonquil never sees. The panel also logs an agent attaching or leaving, an attached runtime losing its connection, and a runtime starting or failing to start.
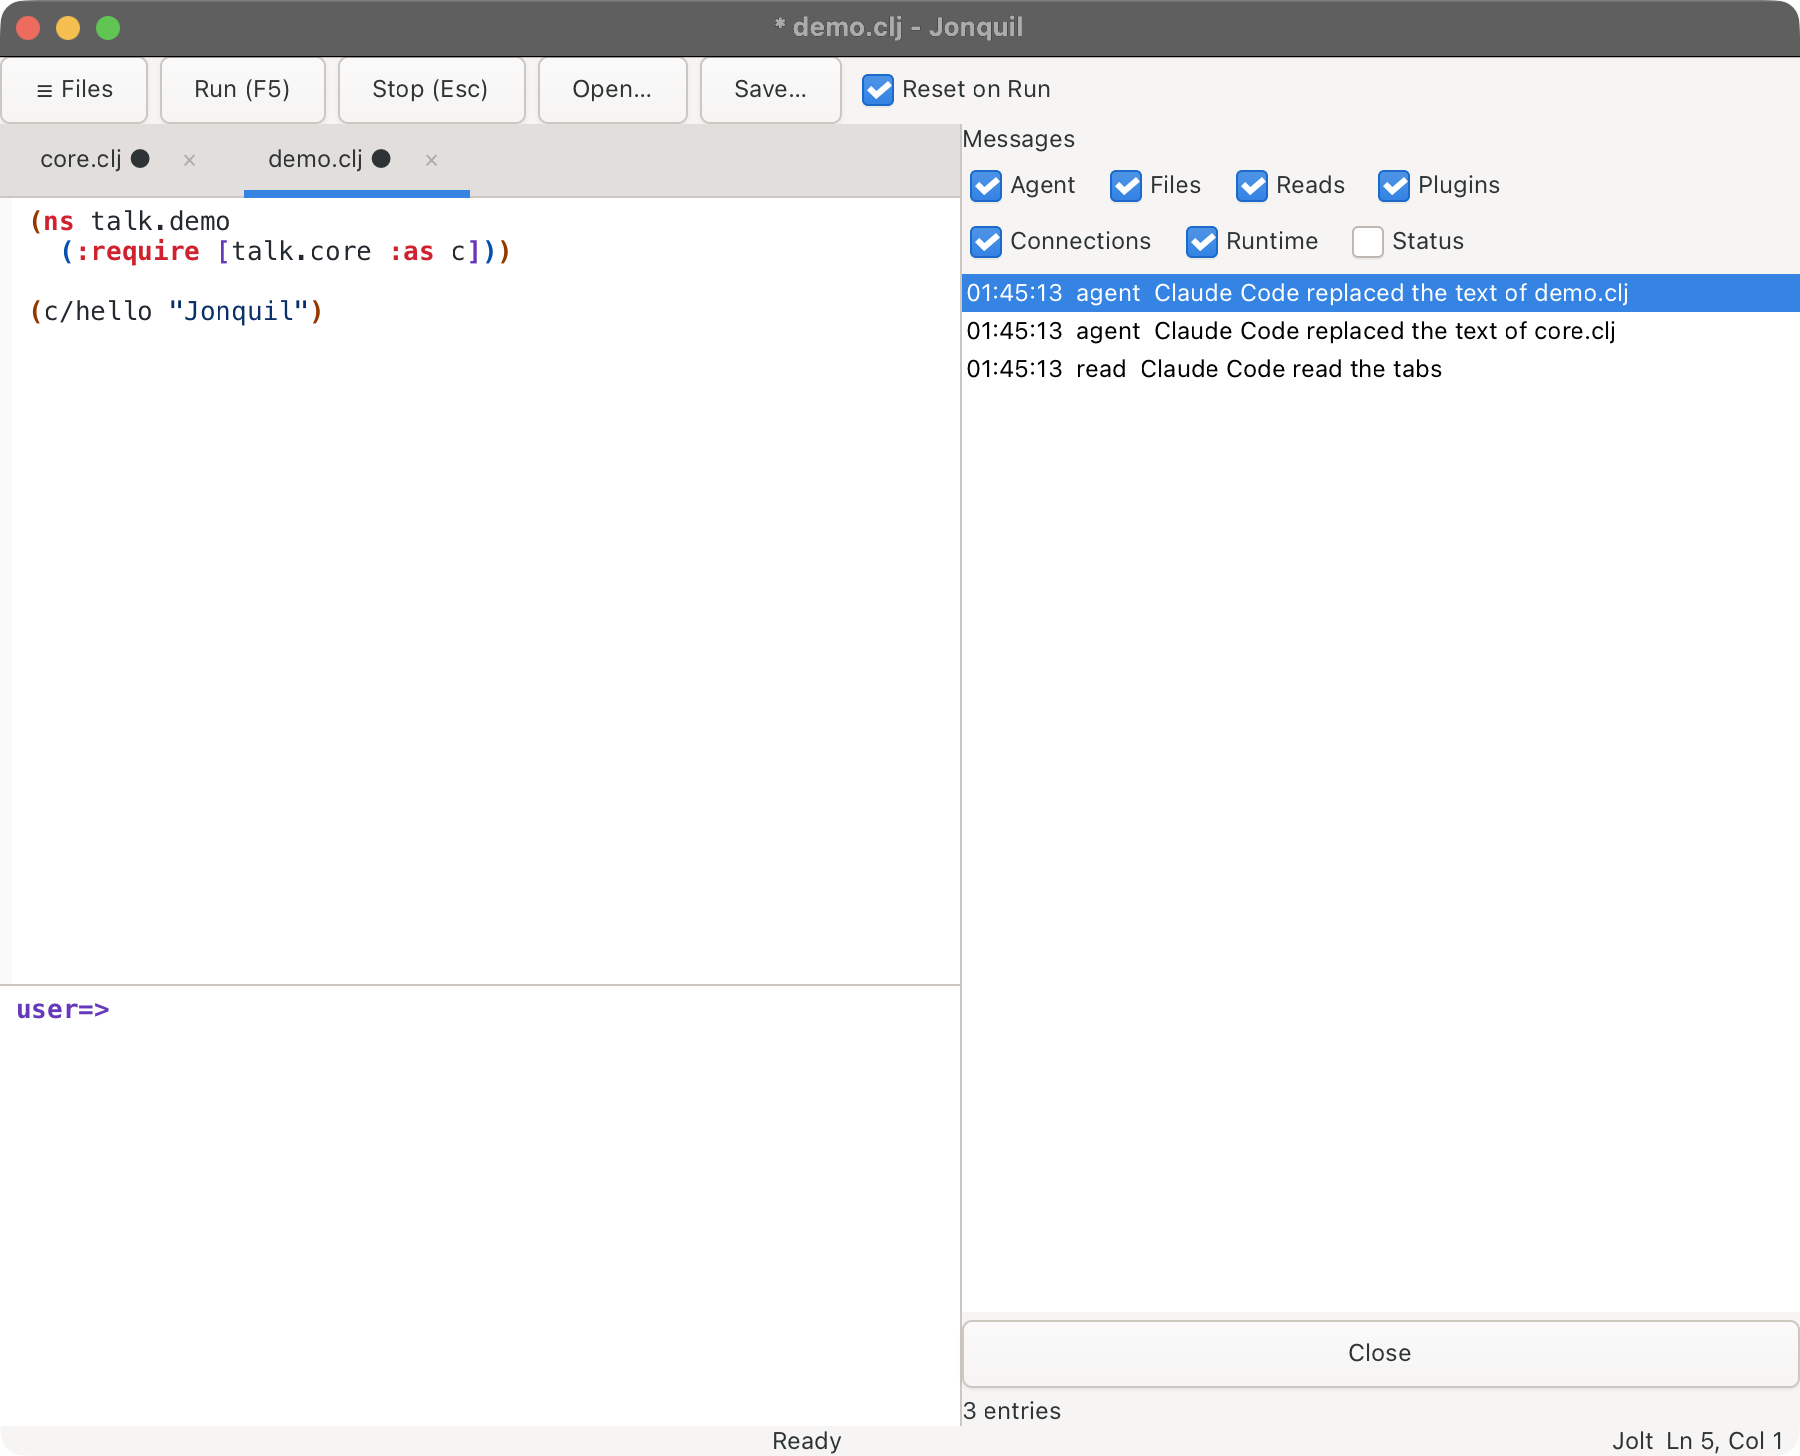
The tick boxes above the list choose what shows. Agent, Files, Plugins, Connections and Runtime are on to begin with. Reads (an agent reading a tab, the console or the docs) and Status (everything the status bar has said, with repeats merged into one row like "Ready ×3") are logged but hidden. While there's anything unread of the kinds that start ticked, the status bar shows "● 3 messages", and clicking it opens the panel. Showing the panel marks everything read.
Enter on a row jumps to its tab, and on an agent's evaluation it opens the code and the result below the row, cut at 20 lines. A row for a plugin proposal opens the Review panel. The disk check covers files open in tabs, about every two seconds. A tab with no unsaved edits follows its file, and one with unsaved edits keeps them (When the file changes on disk). The log keeps the newest 1,000 entries, and the footer says how many older ones it dropped.
Describing keys
Three palette commands explain the keys, from the live keymap, plugins included. Describe the next key you press prints what the next key does: the command it runs, its source, and any condition it needs, or that it goes to GTK. That key is only described, never run. List every key binding prints the window's keys, then the editor's, each with its command's description. Show the keys you pressed last lists the last 50 chords with the command that ran for each, or that the window passed it on to the editor or GTK. Typing, including Return, Tab and Backspace, shows only as a count, never as the characters typed. A command's own keys are in the palette's row for it.
When the editor's caret sits on a symbol, the status bar names the keys that act on it, such as Ctrl+Q doc · F12 jump · Shift+F6 rename. They're read from the live keymap, so your own bindings show, and the line follows the caret a moment after it stops. Show what keys do at the caret, in the palette, turns the line off or back on for this session.
The locations list
Three palette commands list places in the buffer, in a panel on the right: List the uses of the symbol at the caret (code only, never comments, strings or keywords), List the definitions of the symbol at the caret (a defmulti and each of its defmethods, for example), and List every match of the find query, or of the selection (the find bar's query when it has one). A list stops at 1,000 places, and its title says when it did. F8 or Cmd/Ctrl+. goes to the next place and Shift+F8 or Cmd/Ctrl+Shift+. to the previous one, selecting it (on a Mac, F8 needs fn, see Keys); a click on a row goes there too, and F8 keeps working after the panel is closed. Places follow ordinary edits, so a line added above one doesn't move it off its text. A place whose text you deleted is reported gone. Format All and reloading the file from disk replace the whole buffer, which leaves the list out of date: F8 says so, and listing again fixes it. Stepping past either end says so. A buffer list belongs to the tab it came from: closing that tab clears it.
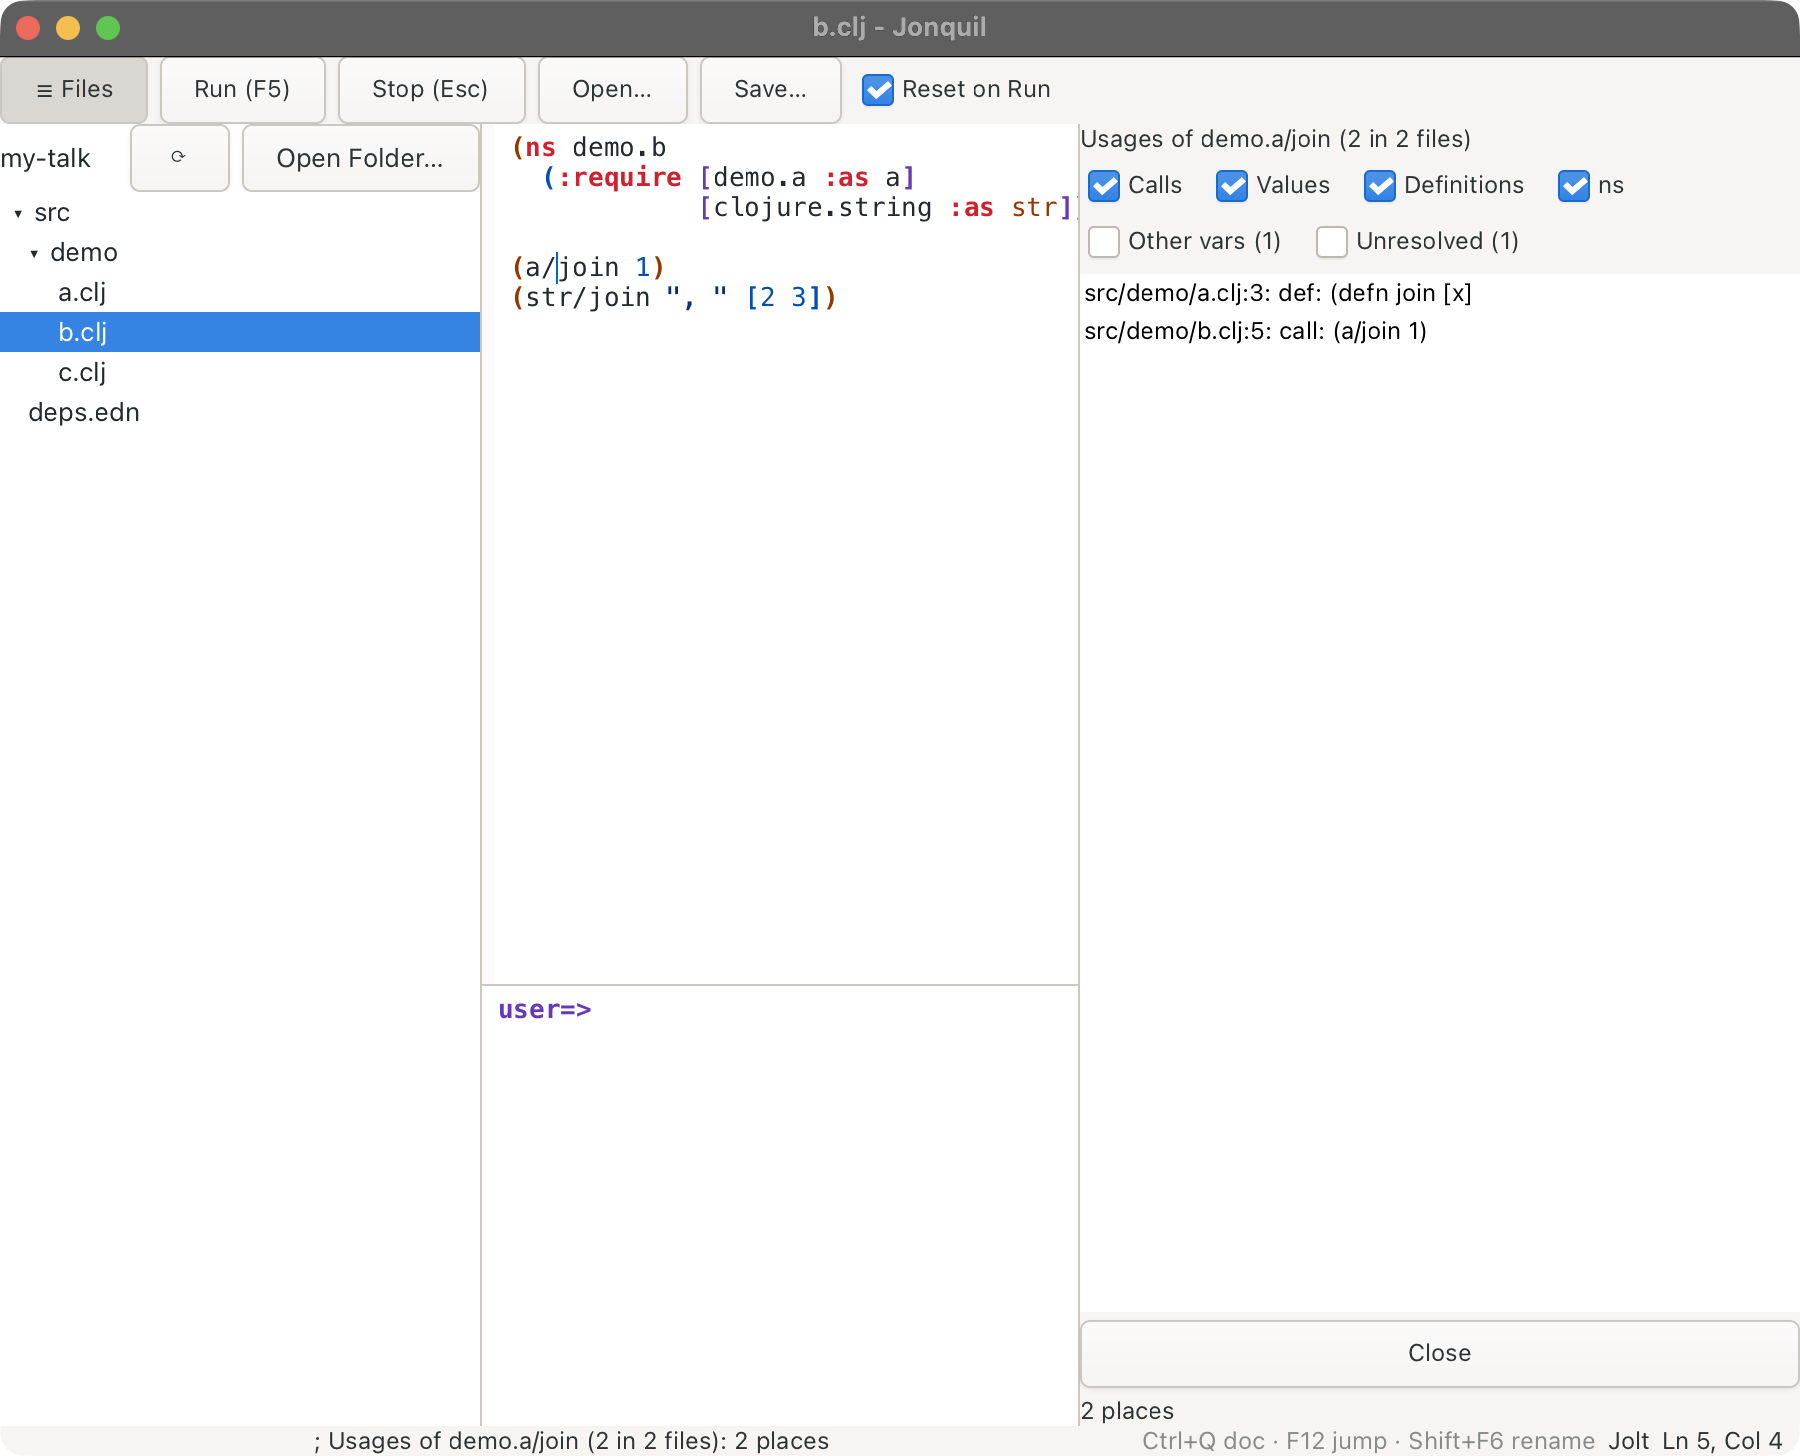
Find Usages in Project lists every use of the symbol at the caret in the project's Clojure files: the folder the file tree shows, or the file's own folder when there's no tree, minus what .gitignore, dot folders, target and node_modules hide. An open tab counts with its unsaved text. It works out which var the symbol at the caret names, from the file's ns form (its aliases, :refer lists and :refer-clojure options), the file's own definitions, the local bindings around the symbol and clojure.core, and decides each place it finds the same way. So with the caret on str/join, a join of your own in another namespace isn't listed, and neither is a let-bound join. Two more check boxes under the kinds bring the rest back: Other vars (another var, or a local, with the same name) and Unresolved, for places a file can't decide from its own text, such as a name brought in by :refer :all, (:use ...) or a top-level require (in a file with :refer :all or :use, a clojure.core name too, since one of those may shadow it), or one a macro defines. Each box shows how many places it holds, and their rows say other var or unresolved after the kind. When the symbol at the caret is itself a local, or can't be decided, the list matches by name instead, so str/join and clojure.string/join both count as uses of join, and the two boxes stay hidden. A .cljc file is read for the window's dialect. Each row reads path:line: kind: text, where the kind says how the name is used: a call (the first thing in a list, (join ...) or #(join ...)), a value (passed around, (map join xs)), a def (the name a def form defines), or ns (inside the ns form, such as :refer [join]). The check boxes above the list show or hide each kind. F8 steps through the shown rows and opens each file in a tab when it gets there, and from then on that file's places follow its edits as a buffer list's do. A file whose text changed after the search, on disk or in its tab, isn't stepped into at the old places: F8 says it changed, and searching again fixes it. Closing a tab keeps the list, and F8 opens that file again. Like the other lists it stops at 1,000 places. The search runs in the background, so typing carries on while it looks.
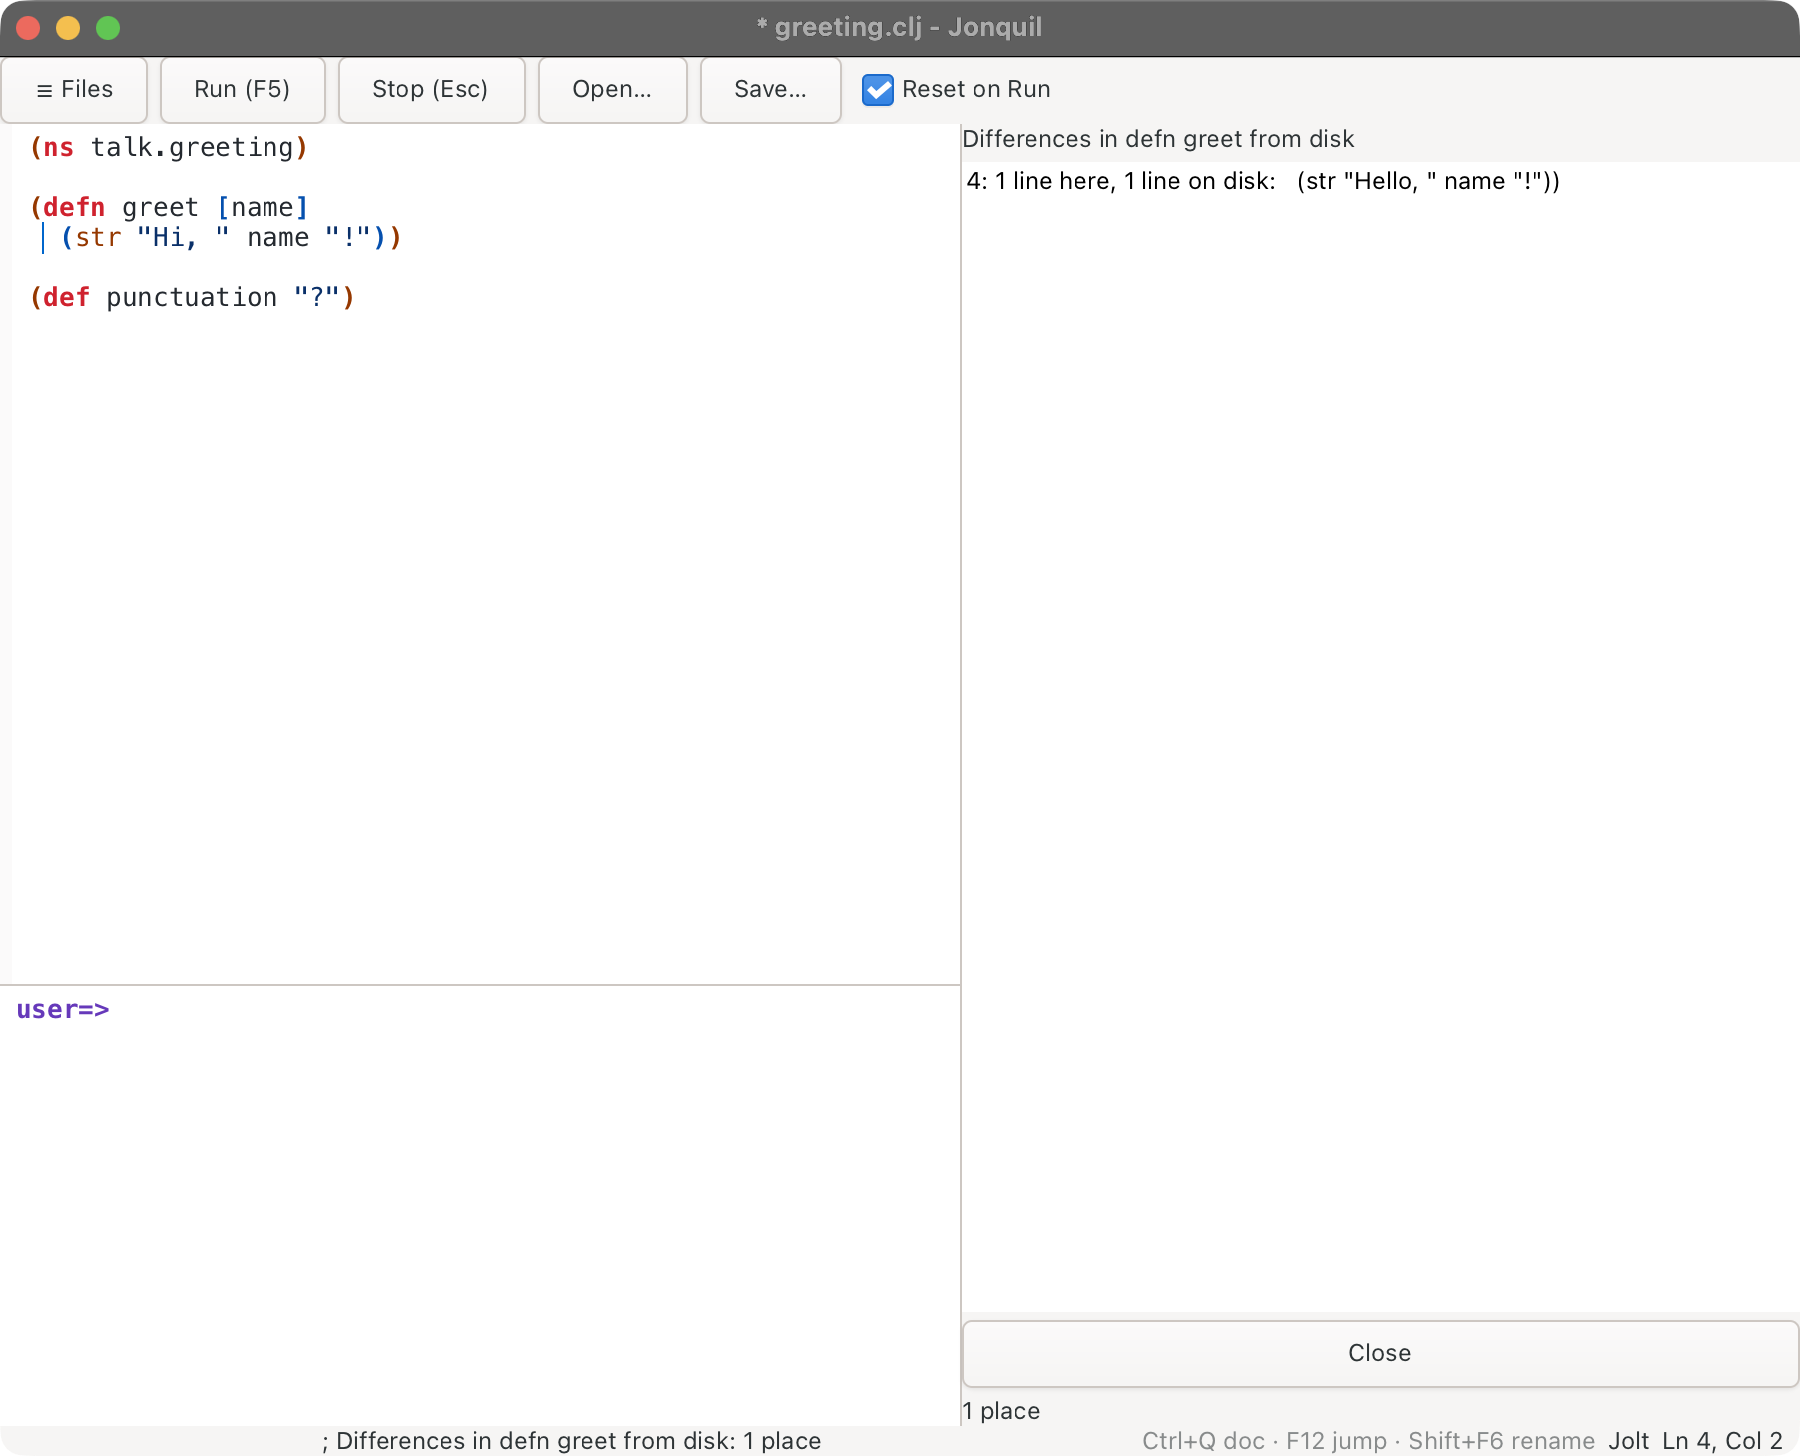
Compare with the file on disk and Compare with git HEAD list the places where the tab differs from that version, one row per difference, such as 4: 2 lines here, 1 line in HEAD: (def c 3) with the other version's first line. F8 steps through them like any list. Take the other version here puts the compared version's lines in place of the difference at the caret, as one step Cmd/Ctrl+Z undoes and with Parinfer left out of it, and lists what's left. git runs as git show HEAD:./name in the file's own folder, so a file outside a repository, or one git doesn't track, gets git's reason on the status bar. Line endings and trailing blank lines don't count as differences, and a Take keeps the tab's own line endings.
Compare with tab: does the same against another open tab, as that tab is right now, saved or not. The palette has one entry per open tab, such as Compare with tab: core.clj, the tab you used most recently first. Take reads that tab again, so an edit made there after the compare is what comes back. If the tab has closed since, Take uses the text it had at the compare.
Compare with the last Run compares the tab with what its last whole Run sent, so you can see what you've changed since the code that's running was loaded. Only a Run of the whole tab that ended without an error counts; Run Form and Run Selection don't move it. Before the first such Run the status bar says there's nothing to compare with yet.
This form vs the file on disk, vs git HEAD and vs the last Run do the same for just the top-level form around the caret, so the other forms' edits stay out of the list. The form is found in the other version by its first two elements, such as defn f (three for a defmethod, whose dispatch value tells its methods apart, and just comment for a comment block), and by its place among forms that share them, so a second (comment ...) block matches the second one there. The list's title names the form, with its place when it isn't the first, Take works the same way, and a version with no such form says so on the status bar. Adding or removing a form that starts the same way, above or below it, moves its place, so Take then asks you to compare again rather than guess. Typing "this form" in the palette finds the three.
Freeing Ctrl+Space on macOS
macOS reserves Ctrl+Space for "Select the previous input source" (System Settings > Keyboard > Keyboard Shortcuts > Input Sources). While it's on, the keypress never reaches Jonquil. Turn it off or rebind it to use completion.
Inspecting values
Cmd/Ctrl+I opens the inspector on the last result (*1). Cmd/Ctrl+Shift+I evaluates the form at the caret, as Run Form would, and inspects that. The panel takes focus until you close it.
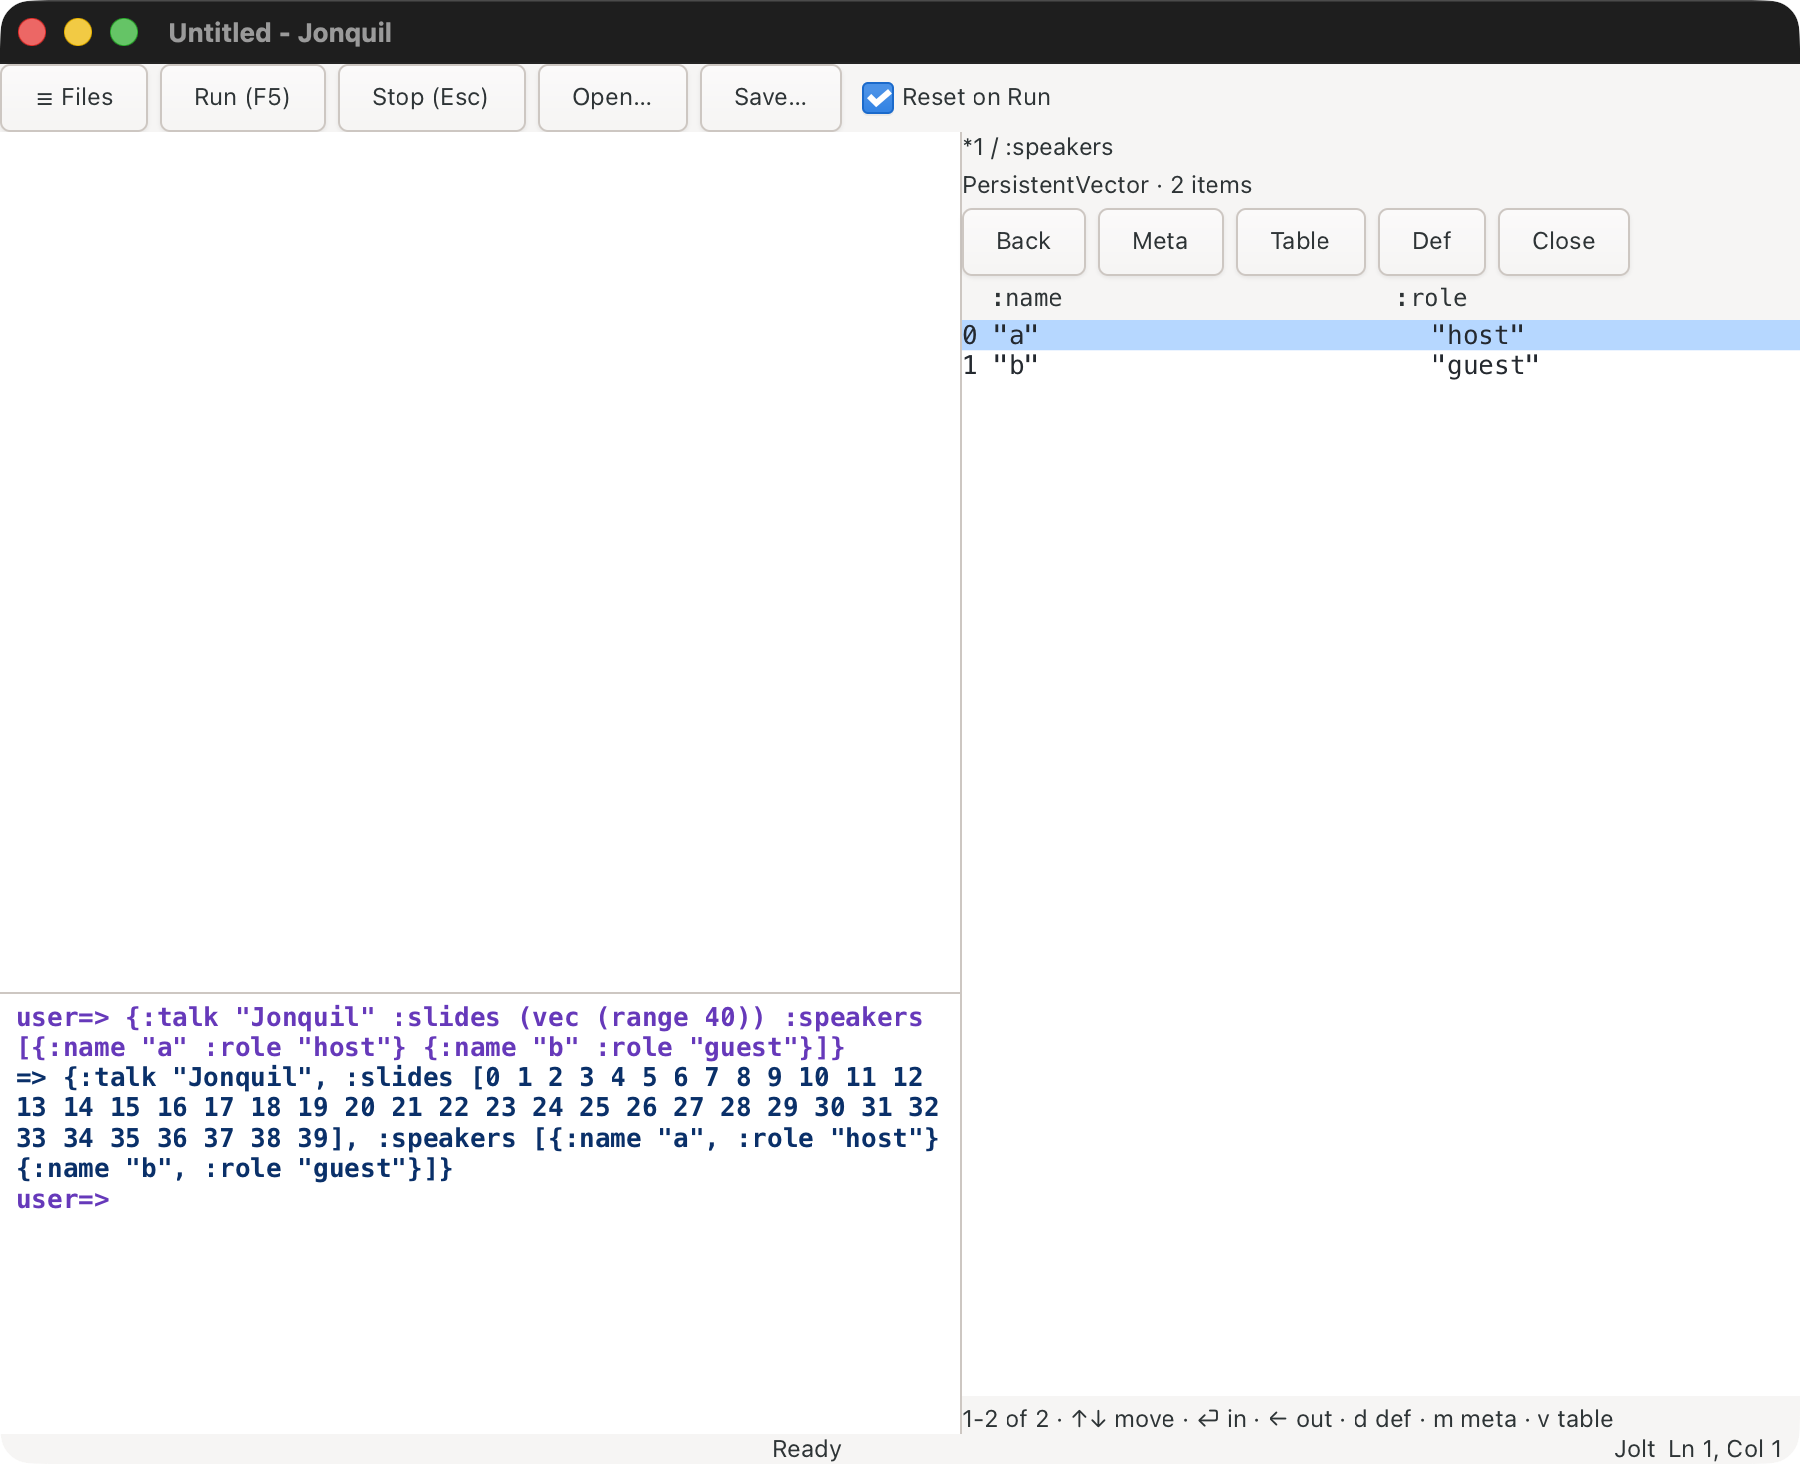
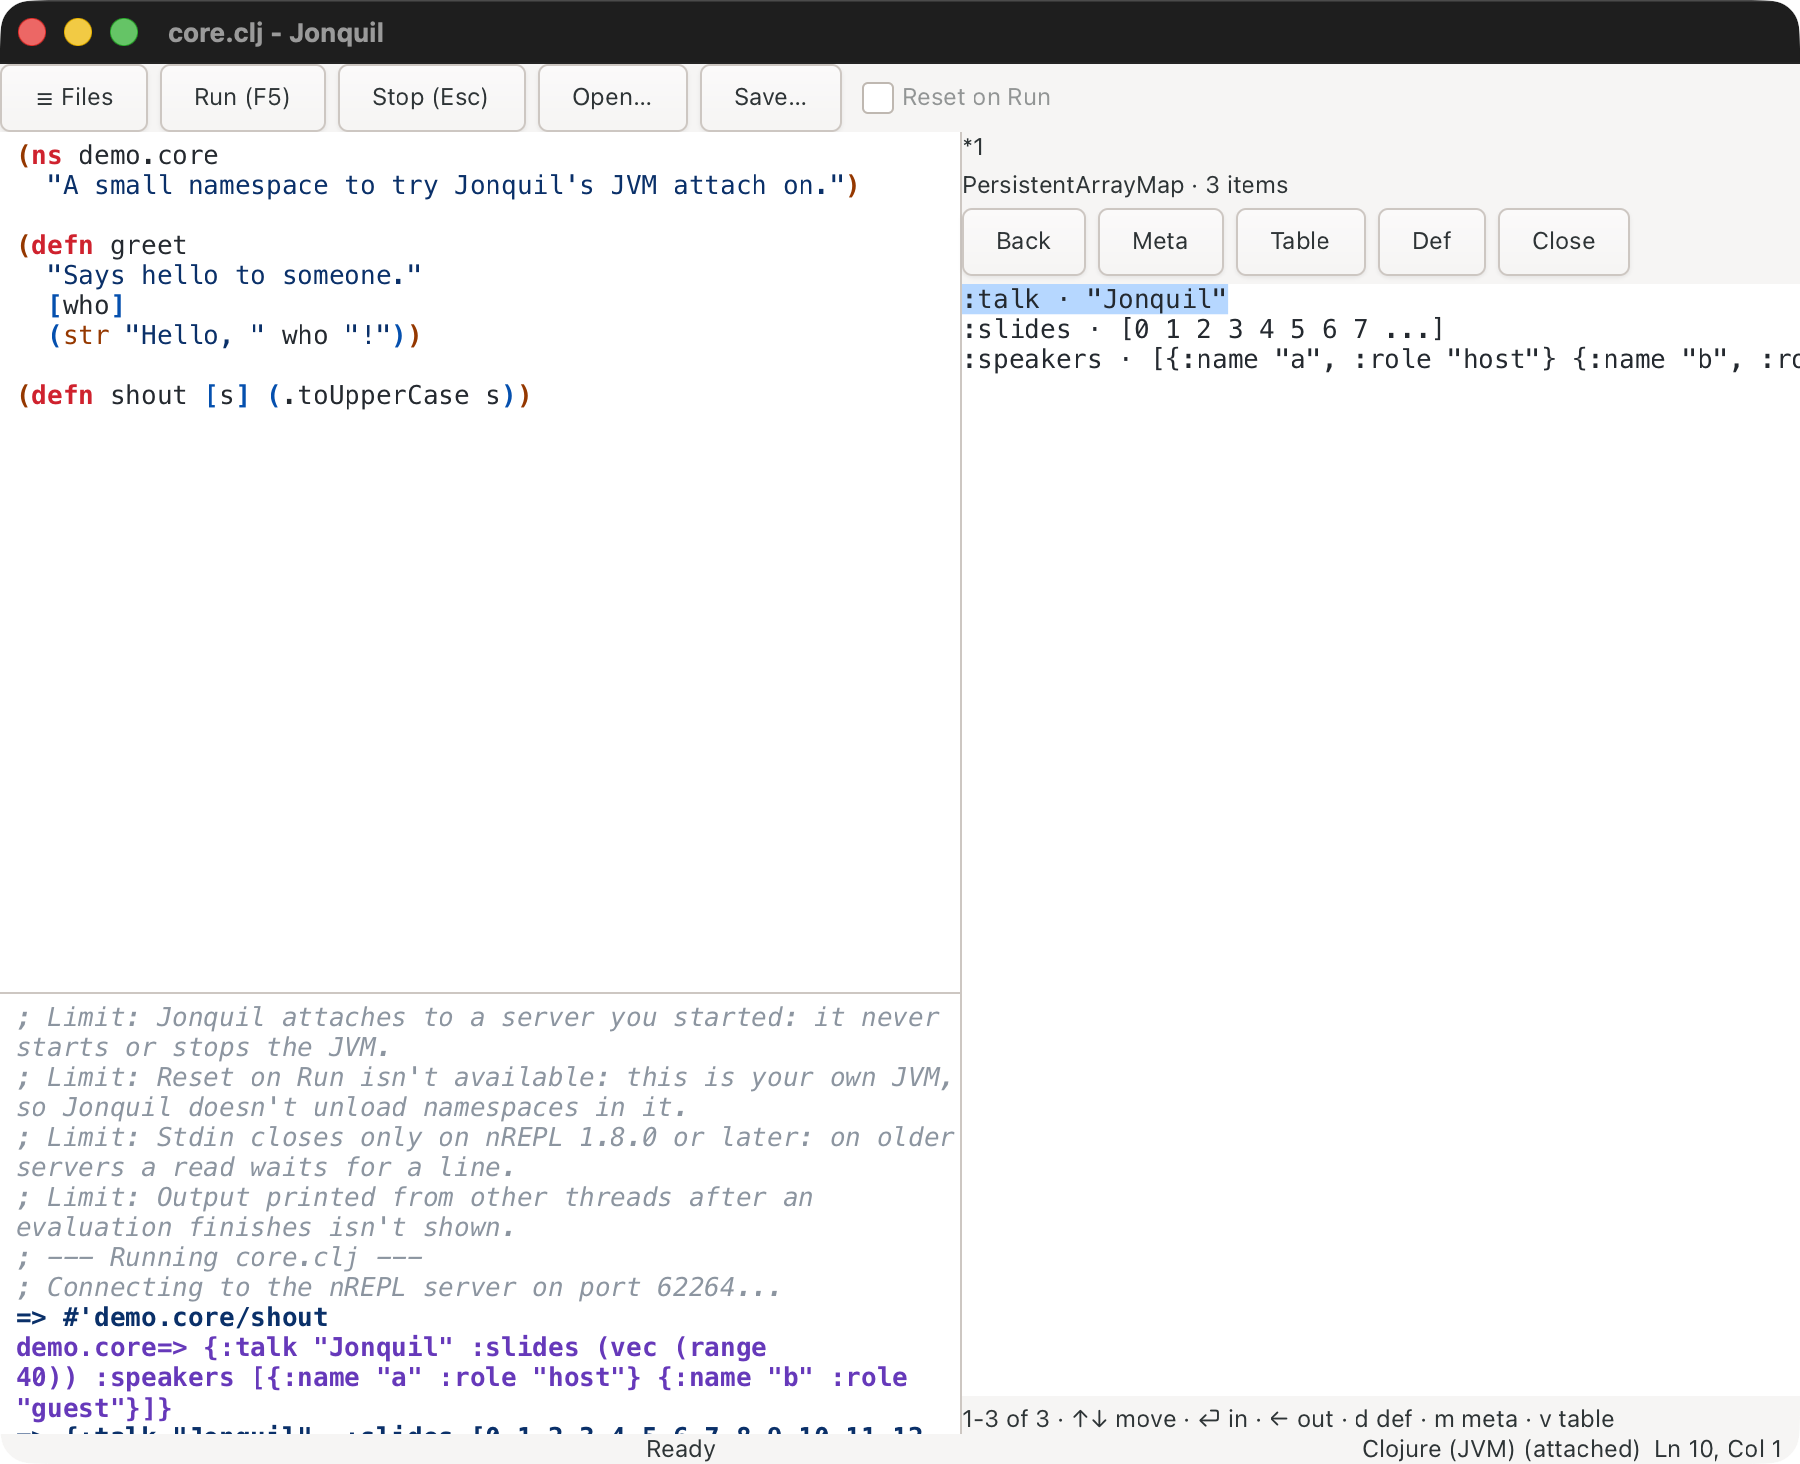
The panel on the right shows a path, the value's type and size, a toolbar (Back, Earlier, Later, Meta, Table, Def, Close), the rows, and a footer of keys. A collection's rows read label · preview; maps sharing the same keys become a table. The path starts with where the value came from: *1 for the last result, the printed line for a console result you clicked (its first 40 characters), a local's name, or a traced call such as (demo.core/area 3).
- Up and Down move. Return or Right goes in; Left or Backspace comes out.
- Page Up and Page Down page through long collections.
mtoggles metadata;vswitches a table to a list and back.dprompts for a name and defines that var from the current value.[and], or Earlier and Later, go back and forward among the objects you inspected, each opened at its top; the footer then readsobject 2 of 3.- Escape closes the panel (inside the
dprompt, only the prompt).
The inspector remembers the last 10 objects it was opened on (an object inspected twice in a row counts once), and opening a new one after going back drops the later ones, as a browser does. It keeps the objects themselves so they can be browsed again, so a large result stays in memory until 10 newer inspections push it out. The history works with Jolt, in process and out; a JVM server's inspector keeps only its current object, so there Earlier and Later say "This server keeps only the object it shows now."
Out of process, Jonquil loads the inspector into its Jolt child as nREPL middleware, so stepping through a value never changes *1, *2 or *3. Collections cap at 1000 entries (1000+ items). Runtime support is in Known limits.
On the JVM
- Before your first Run, Cmd/Ctrl+I says "Nothing to inspect yet: Jonquil isn't attached to the server. Run something first."
- If the server dies, the footer reads "Lost the connection to the nREPL server." and actions stay disabled until you reopen the panel.
- The server keeps one inspector view per connection, so another tool on the same server can replace yours.
Live results
Every result and error line the console prints keeps hold of its value, so an older one stays inspectable after later entries. Click a result line and the inspector opens on that value a moment later, once a double-click would have come (on macOS that's the system's double-click speed); a double-click selects a word instead, and a drag that selects text doesn't count as a click either. Right-click a line (which puts the caret there) or put the caret in it, and the console's menu and the palette act on that result:
- Inspect This Result opens it in the inspector.
- Copy This Result copies the printed value, without the
=>. - Define a Var for This Result puts
(def (jonquil.results-rt/value! 7 "…"))at the prompt with the caret where the name goes, so the live value gets a name; Enter defines it. The second argument names the runtime that kept it. - Jump to This Var, for a var such as
#'demo.core/area, opens its definition as F12 does. - Quick Doc for This Var, for a var, prints the doc quick doc would show into the console, as
;comment lines under the result, so it stays there to scroll back to.
The kinds are a value, a var, a namespace and an exception. Each verb asks a table of what each kind offers before it acts, so Jump to This Var or Quick Doc for This Var on a number says the result isn't a var. The last 100 results are kept; an older one, or one kept by a runtime that has since restarted, says it's gone, and Define's form throws "That result is gone." for it rather than defining a placeholder. Live results come from Jolt, in process or in a project's Jolt child, and quiet evaluations (completion, help) keep nothing; other runtimes print results as plain text.
A file and line in console output, such as src/app/core.clj:12:3 in an error's location or (core.clj:12) in a JVM stack frame, opens there with a click, with the same wait for a double-click, or with Open This File and Line from the console's menu or the palette, the caret in it. This works for any runtime, since it reads the text. A path under the project folder, or an absolute one, opens as written; a bare name opens the project file that ends with it, and when several do, the namespace in a stack frame (demo.core$f.invoke means demo/core.clj) picks one. Otherwise the status bar says how many files could be meant and opens none. A project file opens in a tab and any other file in the source panel, as a jump to a definition does.
Tracing a function
Trace the function at the caret, in the palette, wraps that function so every call to it is recorded; run it again on the same name to stop. Show the calls of the traced functions opens the Trace panel on the right, one row per call, oldest first and indented by how deep it was called from another traced function:
(user/tall 2) => [[0 0] [1 1]]
  (user/tpair 0) => [0 0]
  (user/tpair 1) => [1 1]
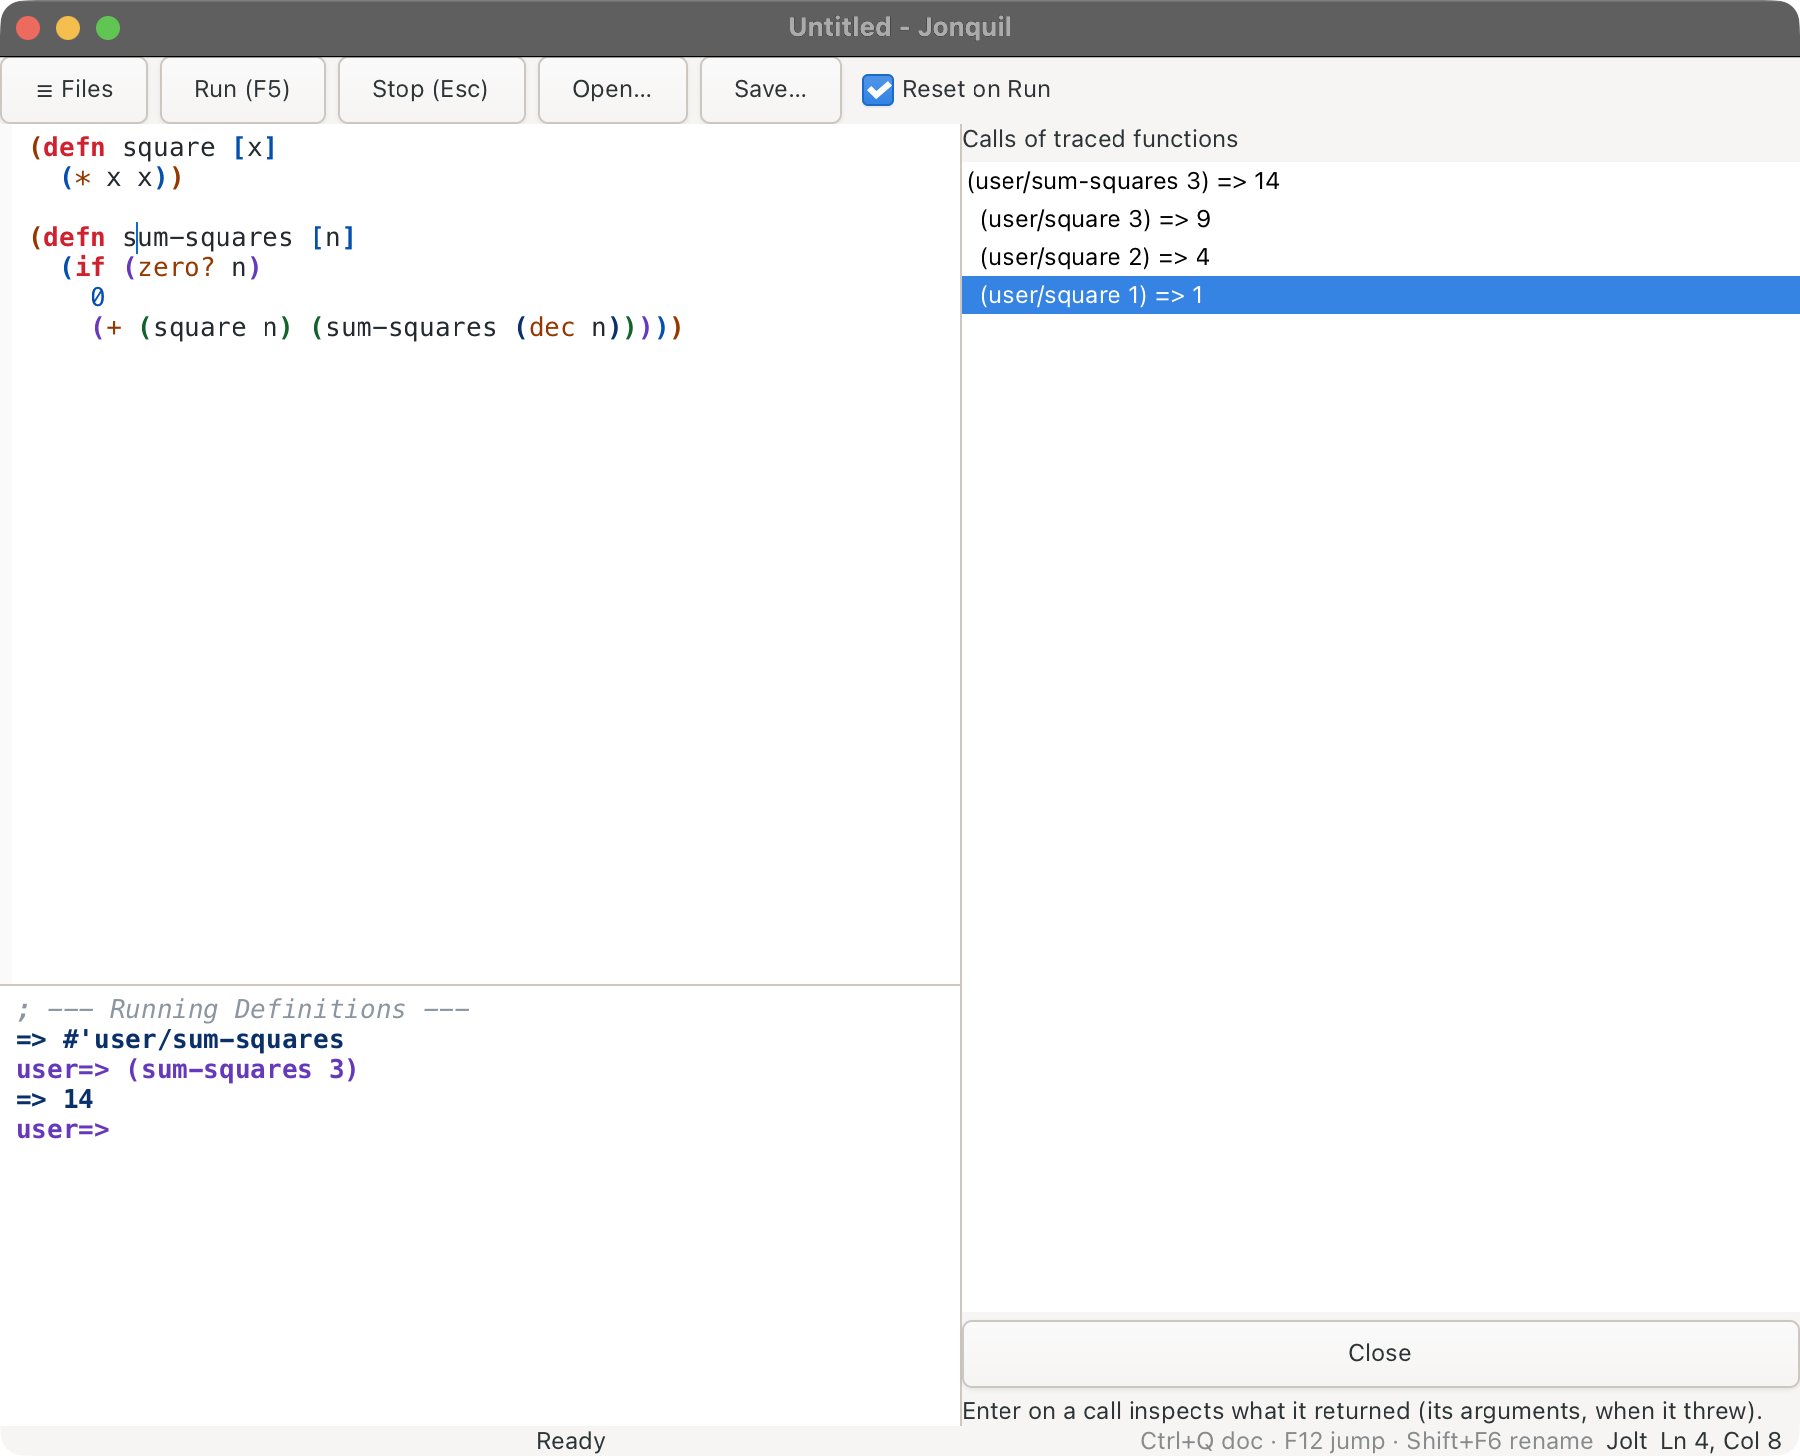
A call that threw reads threw and the error, and one still running reads (running). Enter on a row opens what that call returned in the inspector, or its arguments when it threw. The panel refreshes after every evaluation while it's open. Values print as the Frames panel's locals do, and a lazy seq nothing has realized is never realized for the row, nor kept, so a traced function can still hand out a seq too big to hold. Calls made while a lazy result is realized happen after the call that returned it has finished, so they show at the top level, not under it. The last 500 calls are kept; Clear the recorded calls forgets them, and Stop tracing every function unwraps everything.
Calls from functions compiled before the trace still go through it. Jolt doesn't record a traced function's call to itself, only the outer call, and redefining a traced function (Run again) replaces the wrapper, so the new definition isn't traced. Tracing runs where your code runs, in process or in a project's Jolt child, and doesn't touch *1; other runtimes say it needs Jolt for now.
The Processes panel
Show the processes, in the palette, or Cmd/Ctrl+Alt+8 opens the Processes panel: the fibers your program spawned with jolt.fibers/spawn, newest first, each with its number, its state as Jolt reports it (running, ready, parked, done or dead), the function it runs and how long ago it started. Interrupt raises an error in the selected fiber ("Interrupted from Jonquil's Processes panel"), which a masked region holds off until it ends, and Kill ends it outright. Forget finished drops the done and dead ones; Jonquil keeps the last 50 of those anyway. While the panel shows, it refreshes every second.
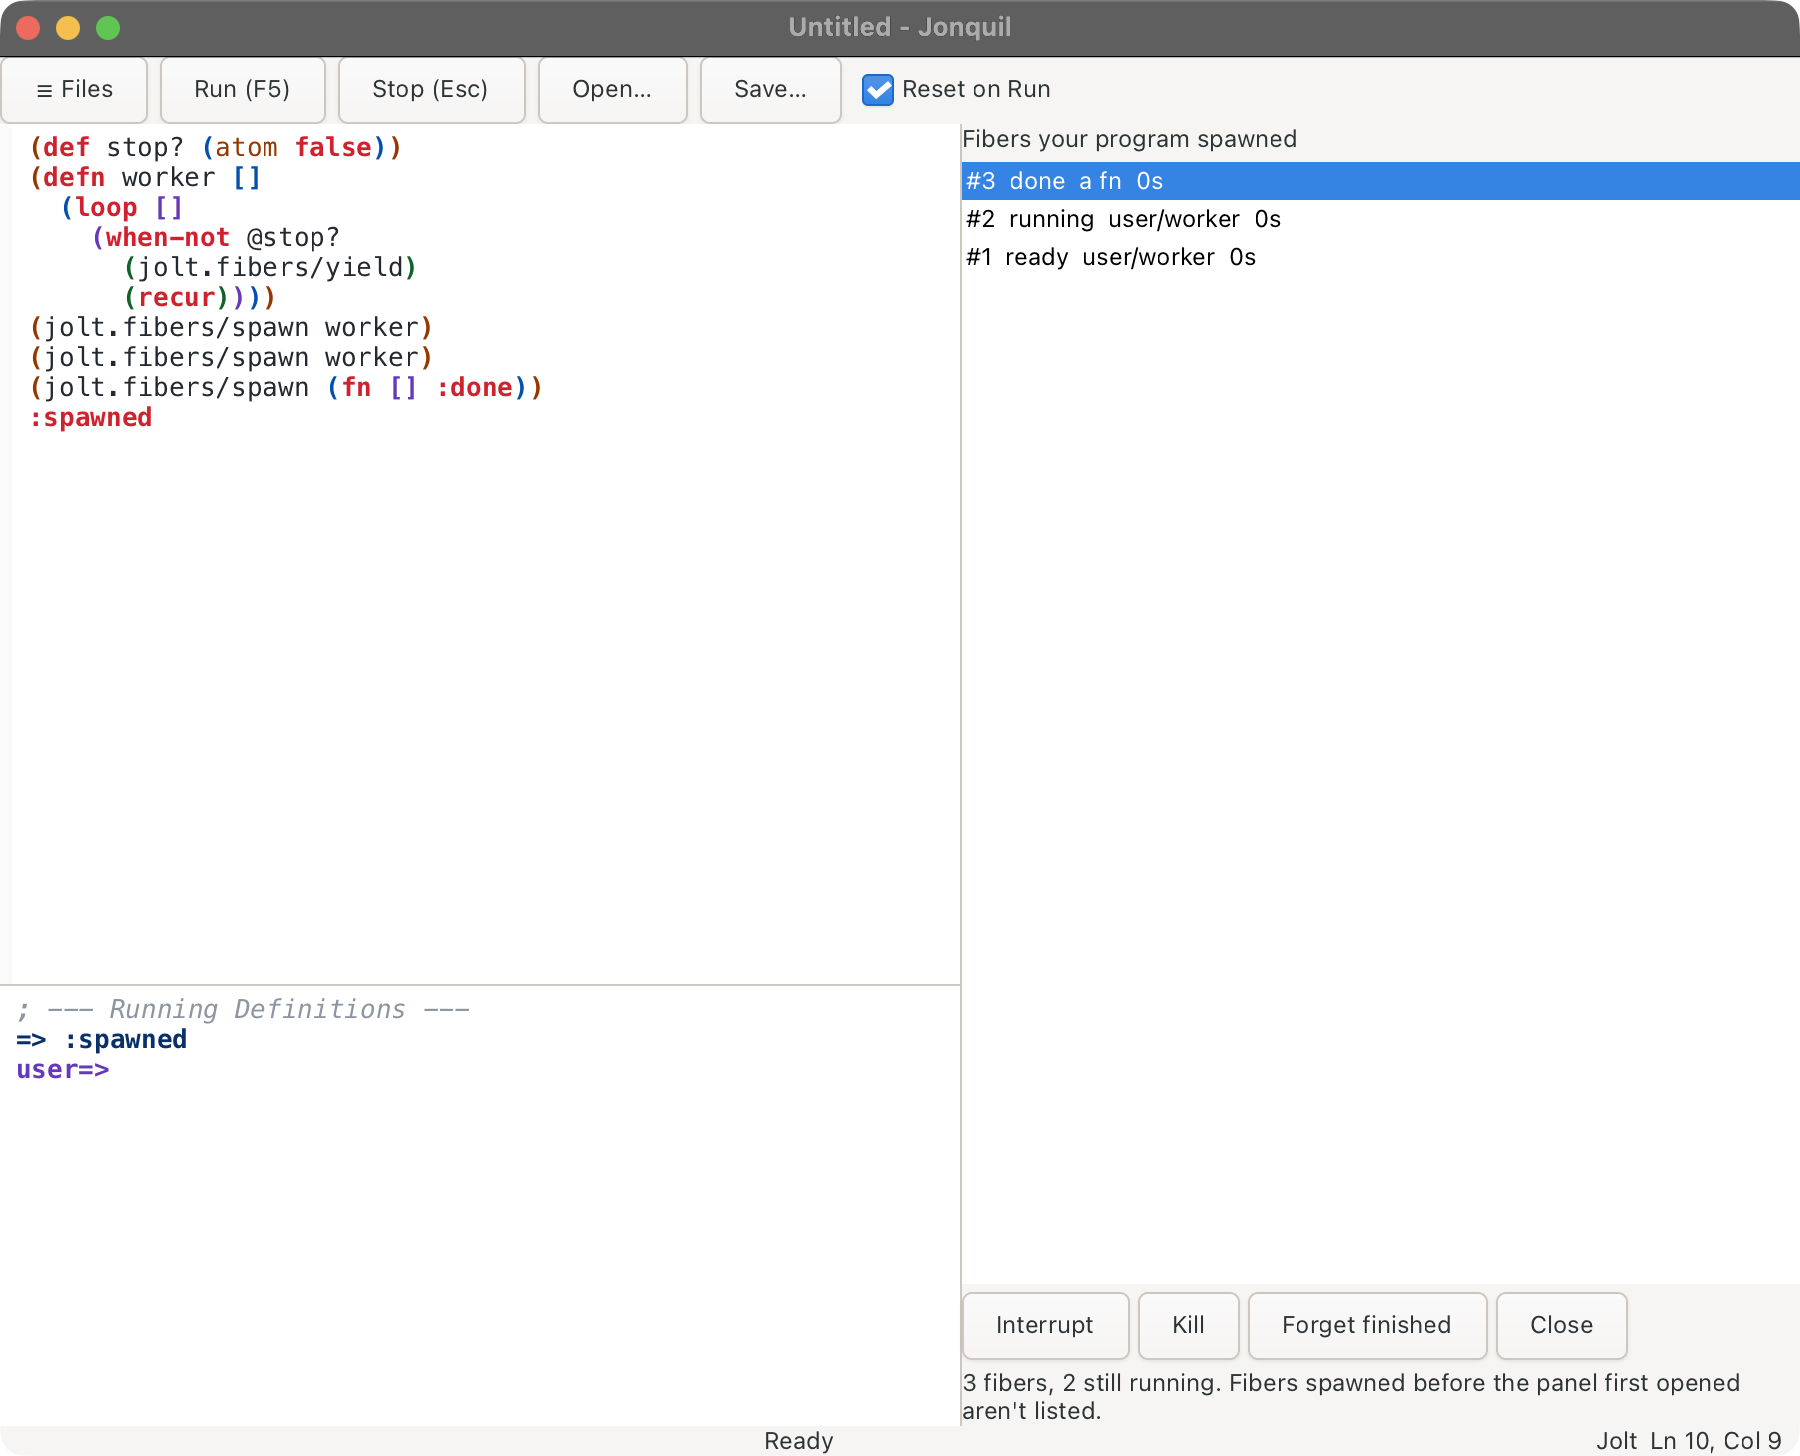
Jolt keeps no list of live fibers (jolt-lang/jolt#1606 asks for one), so the first time the panel opens Jonquil starts watching spawn, the way Trace wraps a function, and code compiled earlier goes through it too. Fibers spawned before that aren't listed. Neither are the fibers core.async starts itself, for io-thread, for go blocks on its fiber backend and for flow processes, because they don't go through spawn. Threads (future, agents) aren't fibers, so they're not listed either. It works in process and in a project's Jolt child; other runtimes say it needs Jolt.
Counting how often each line runs
Count how often each line runs, in the palette, turns on Jolt's line counters for code compiled from then on. Run a saved file and the gutter shows, beside each line that ran, how many times it did: 6, 999, 1.2k, 12k. Each Run counts its own lines alone. The counts are for the text that ran, so the first edit hides them until the next Run, and a Run Form or Run Selection refreshes them only while the file still holds the text its last Run did. An Untitled or unsaved tab has no file for Jolt to count by, and the console says so. Clear line counts zeroes the counters, and the toggle again turns counting off.
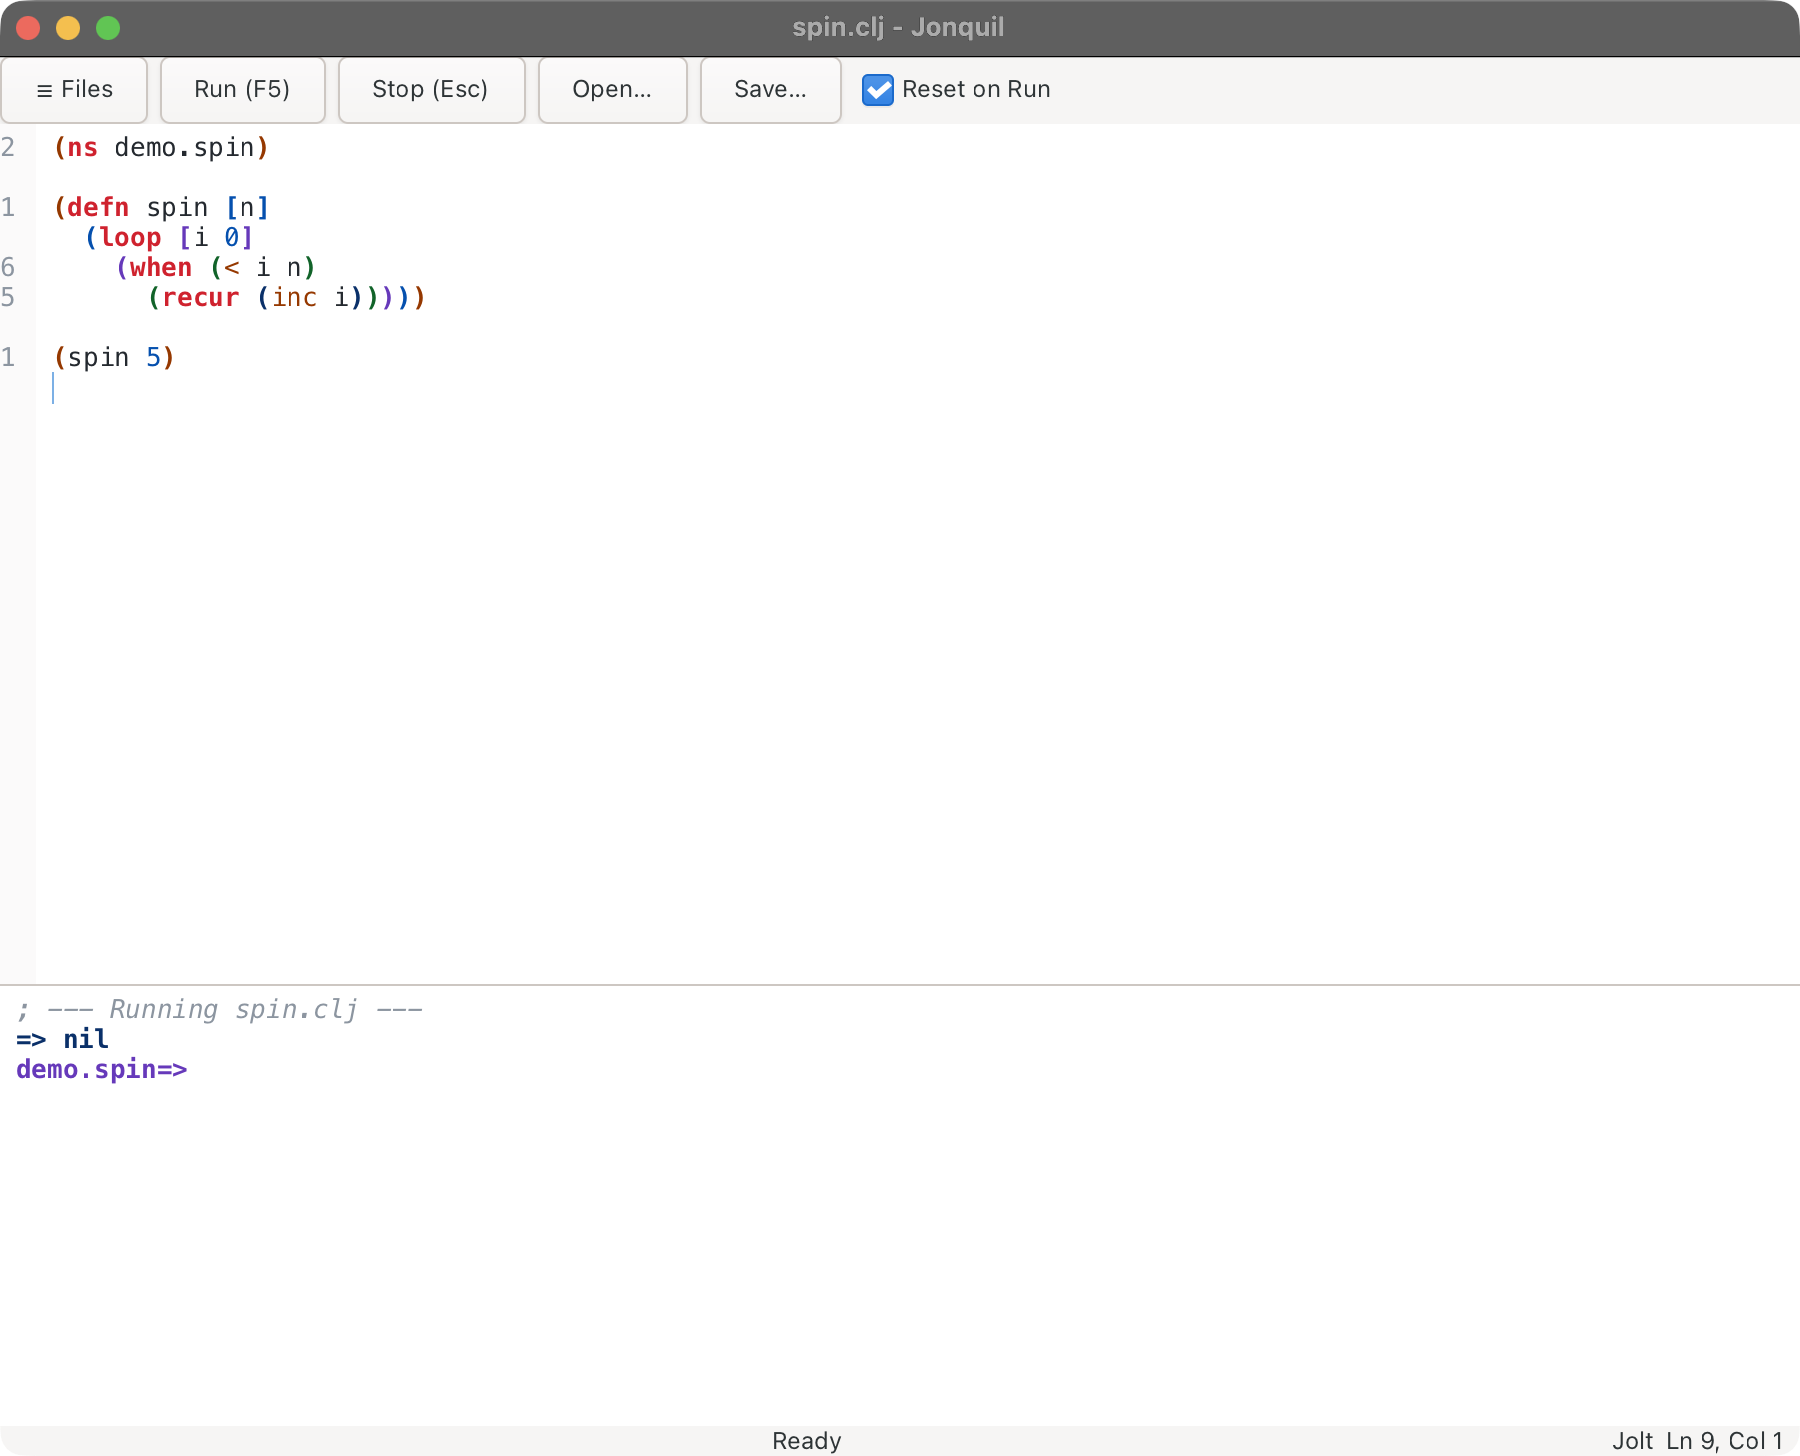
Jolt has one instrumentation mode at a time, so counting and Keep every local (debug mode) take turns: turning one on turns the other off, and the status bar says so. A Jolt child that restarts comes back without counting, and the next Run says so on the console. Counting works in process and in a project's Jolt child, on a Jolt with jolt.profile (v0.8.24 or later); other runtimes say it needs Jolt.
The last error's frames
After an error in Jolt, Show the last error's frames and locals, in the palette, opens the Frames panel on the right. Its title is the error, such as ArithmeticException: Divide by zero. Below it is one row per frame of the call stack, innermost first, and under each frame its locals:
user/dbg-inner  line 2 (no file)
    n = 3
    xs = [1 2 3]
Frames stop where Jonquil's own evaluation code starts, so the list shows your code. Return or a click on a frame opens its file at that line, in a tab for a file of your project and in the source panel for anything else. Code typed at the prompt or run from an unsaved buffer has no file, so its frame shows the line within that text and says so instead. A Run of a saved file keeps the file on a Jolt whose eval-string takes a source path (Jolt v0.8.24 or later, jolt-lang/jolt#1476). Return or a click on a local opens its value in the inspector, where it lives, so even a huge or lazy value is never copied out. A local's row prints at most 8 items, 3 levels deep, and 100 characters. A lazy seq nothing has realized yet reads <lazy seq, not realized>, because printing it would run your code again (a (map save! rows) would save the rows again); opening it in the inspector realizes it.
Evaluating in a frame
The field under the list evaluates a form in the selected row's frame (a frame row, or one of its locals). The form sees that frame's locals by name and resolves other names in the frame's namespace, so a private function of that namespace works too, and Enter shows it in the console:
; in user/dbg-inner: (count xs)
=> 3
The console shows the code as soon as you press Enter, then what the forms printed (the first 10000 characters) and the last one's value, at most 100 items and 10 levels deep. Several forms run in order. A form that throws shows one line with the error, and Stop stops one that runs too long, saying "Stopped.". Nothing resumes or unwinds: you are looking at a frame that has already stopped, so the error stays the last error, and *1 stays where it was. The forms' own side effects still happen. At run time, *ns* is the prompt's, not the frame's. In the Jolt child the window waits the usual 10 seconds for the answer; press Stop for a form that's still running there. After a newer error, a panel still showing the older one refuses to inspect or evaluate: "The panel shows an older error: show the frames again."
Break on error
Break on error, in the palette, makes a Jolt evaluation stop where it throws, before anything unwinds (run it again to turn it off; it starts off). The console says ; Paused at ArithmeticException: Divide by zero., the evaluation is still running, and the Frames panel opens on the live stack with its title starting Paused: and a Continue button in its bar.
While it's paused, the field evaluates on the thread that threw. A form sees the frame's locals, as after an error, and also everything that was still in effect there: a binding the code was inside still holds, and no finally or with-open has run yet, so a file the code had open is still open. (A try whose catch didn't match the error has already unwound by then, its finally included: Jolt rethrows from it.) Continue (or Continue from the break in the palette) lets the error unwind as it would have, and the panel then shows its frames and the restarts. Stop ends the evaluation instead, and Stop on an evaluation blocked in a sleep or a wait stops it without pausing. Nothing can resume the code or change a local.
Only errors that escape the evaluation pause: one your own code catches doesn't, and neither do Jonquil's quiet evaluations (completion, help, timing). A top-level expression typed at the prompt keeps no frame of its own, so its locals show only inside a function it called; when no frame is your code's, the panel says so instead of listing Jonquil's own. Break on error works for Jolt, in process and in a project's Jolt child, where it needs the child's Jolt to have jolt.debug, the jolt-lang/nrepl middleware Jonquil starts it with, and jolt.nrepl/*eval-wrapper*, the hook Jolt's nREPL server calls around each evaluation (Jolt v0.8.24 or later, jolt-lang/jolt#1474). Turning it on says so when one of them is missing, and the other runtimes say so too.
Breakpoints
Toggle Breakpoint (F9, or the palette) puts a red dot in the gutter on the caret's line, and pressing it there again takes the dot away. When code reaches that line it pauses there, with nothing wrong: the Frames panel opens titled Breakpoint at line 3, the console says ; Paused at the breakpoint on line 3., and everything Break on error offers works the same way. The field evaluates with the frame's locals, a local opens in the inspector, Continue (the panel's button, or Continue from the break in the palette) runs on, and Stop ends the evaluation. Break on error doesn't need to be on.
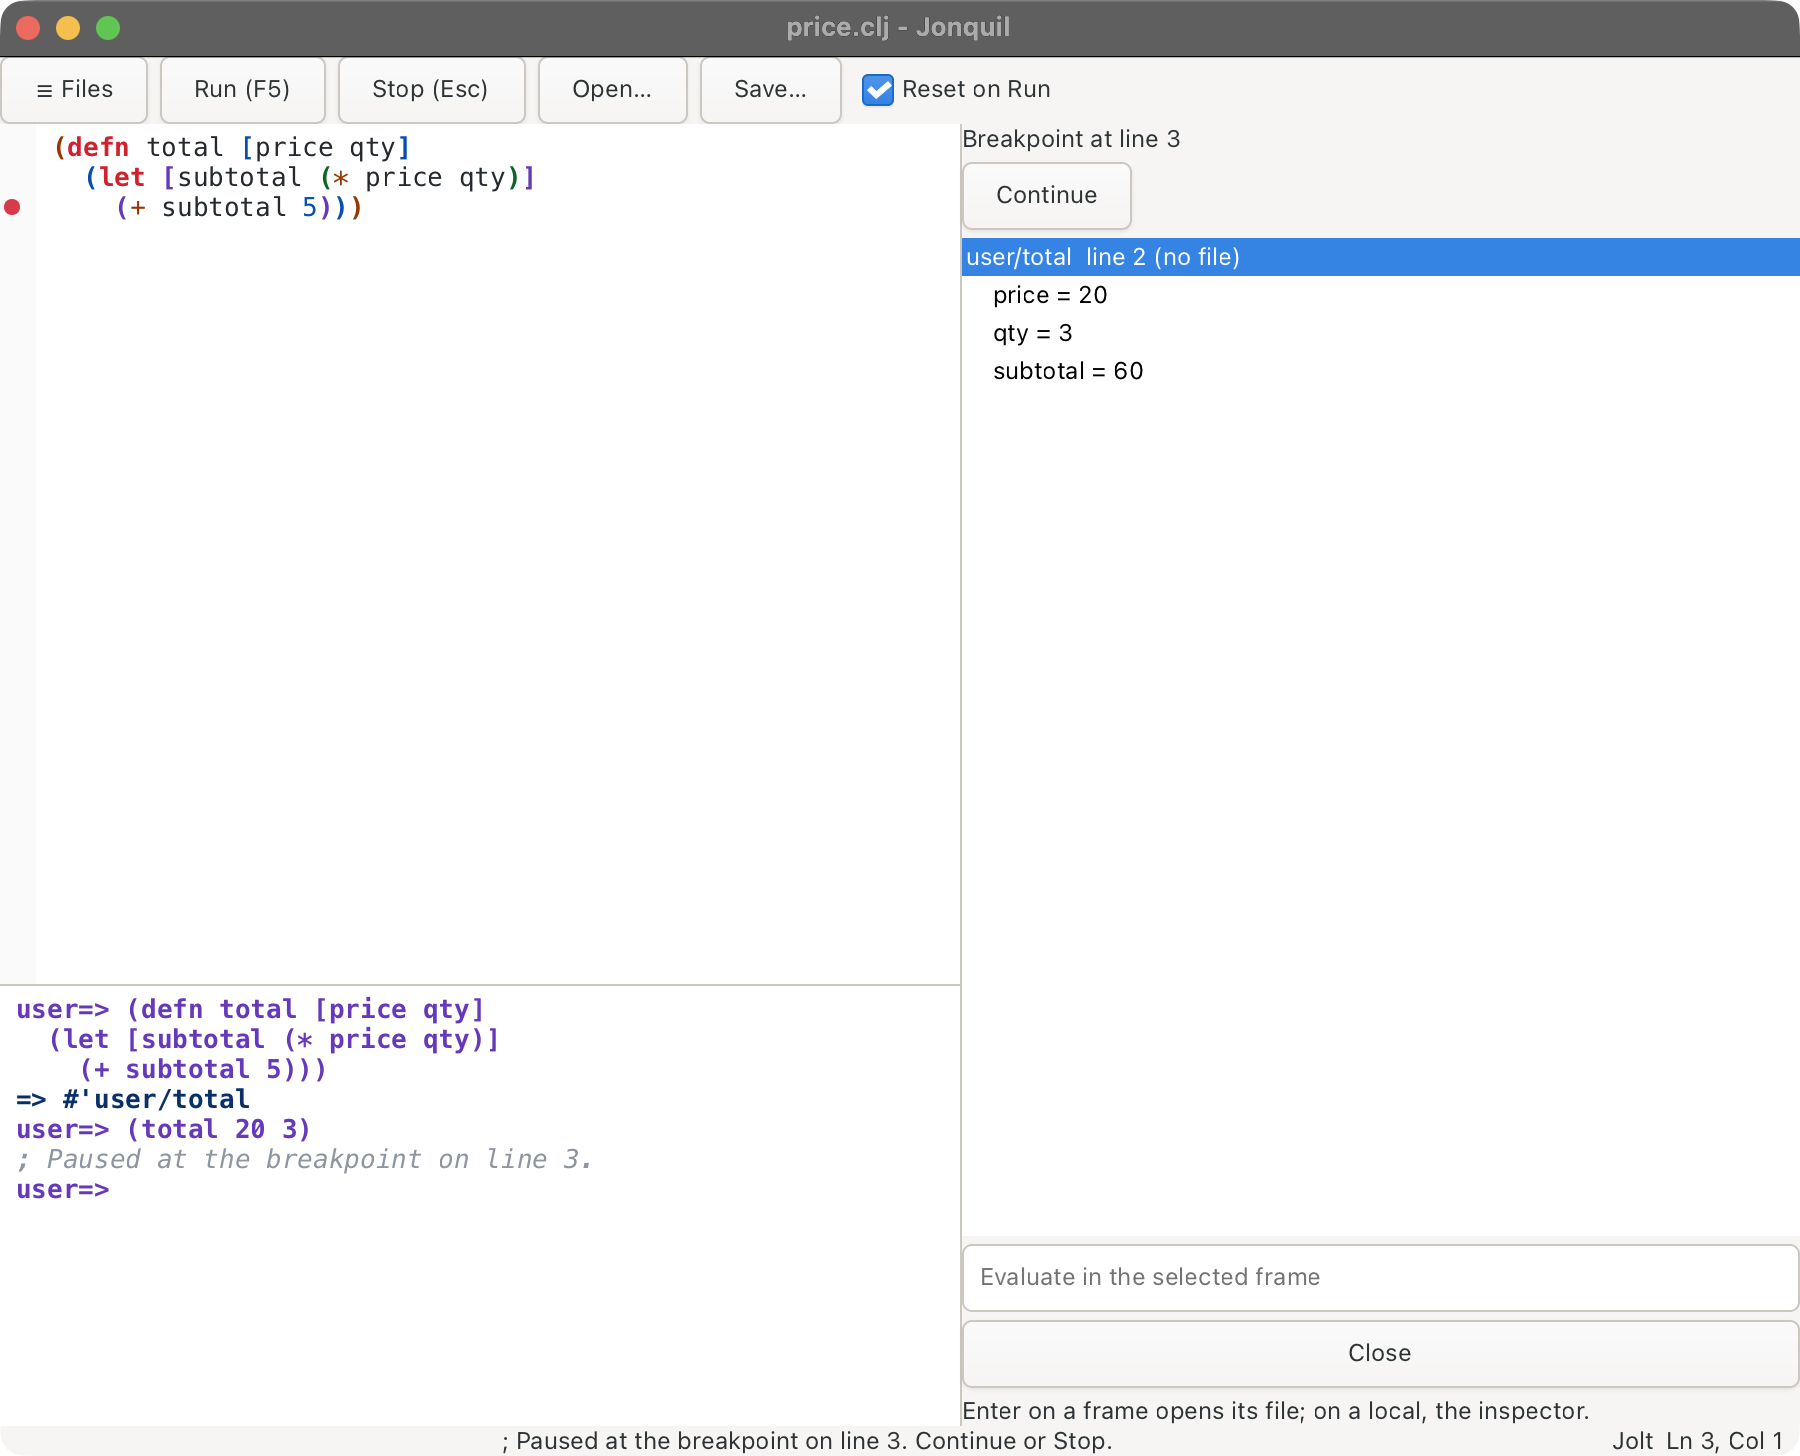
A breakpoint goes before the code that starts on its line, so it needs something there that runs:
- a body form of
defn,fn,let,loop,when,do,doseq,tryand the like: the breakpoint runs as a statement of its own before it; - any other expression whose value is used, such as a call's argument, a
letinit or anifbranch: it is wrapped as(do <breakpoint> expr), which keeps its value.
A line with nothing that can pause (a parameter vector, a binding name, a catch clause, a case test, quoted code, a tagged literal, the ns form, a blank or comment line, anything inside a macro's arguments) moves the dot to the next line that can hold one, and the status bar says Breakpoint moved to line N. The dot is a text mark, so it moves with the line when you edit above it.
Before it places a breakpoint, Toggle Breakpoint asks the runtime what each form's head names in the buffer's namespace. Code inside a macro call is left alone, since the macro may read it as data (s/def, go-loop, a defmacro earlier in the same file), except for the core forms Jonquil knows the shape of (let, when, cond, try and the like). A head that names nothing loaded stays a call, unless the buffer's namespace isn't loaded yet (before its first Run), since a name it refers could be a macro: then every head Jonquil doesn't know counts as one, and the status bar says so, as it does when the runtime can't answer at all. The answer is taken when you toggle and again after each Run that ends well, and Runs in between reuse it: until the next answer, a head typed since and every head after a change to the ns form count as macros. When a Run leaves a dot out because its line is now inside a macro (a name typed since, or one the Run turned out to define), the console says so, and after the Run the status bar names the dots that won't pause.
It works at once. Toggling sends the top-level form holding the line again, the way Run Form does (the console shows it), with every breakpoint it now holds, or without any once the last is gone. So after toggling a breakpoint in a defn, an evaluation that calls that function pauses there, whether you typed it at the console or it runs code in another namespace. Only a form that just defines code is sent this way: defn, defmacro, defmethod, extend-type, extend-protocol, and a def or defonce whose value is literally (fn ...), #(...) or (reify ...). Toggling never runs anything else, so on a form like (def db (connect!)), a top-level call, a deftype, defrecord, defprotocol or defmulti (sending those again makes a new class or dispatch table) or a form inside a (comment ...) block the status bar says it takes effect when you next run this form. A form with edits that haven't run isn't sent either, so the toggle never runs your unfinished edit: after a Run that's what the changed-form mark shows, and in a tab that never ran it's unsaved edits, or a form that differs from the file on disk. The status bar then says this form has edits that haven't run, so Run Form to apply both. If sending the form again fails, the status bar says so and the dot stays.
Run, Run Form and Run Selection send the code with the breakpoints in their text. Each inserted form is one line, so line numbers in errors and frames stay right. require :reload or load-file of the file loads it as saved, without breakpoints; toggling a breakpoint again puts them back. Clear all breakpoints takes every dot in the tab away and sends the forms that held them again without. A tab's breakpoints aren't saved across sessions.
Toggling turns Jolt's debug mode on when it's off, since a paused frame's locals need it, and the status bar says so. One pause at a time: while one is paused, another thread that reaches a breakpoint runs on, and so does an error with Break on error on. Breakpoints work for Jolt, in process and in a project's Jolt child, on a Jolt with jolt.debug; other dialects, and a child whose Jolt lacks it, say why. A breakpoint pauses only during an evaluation you started (a Run or a console entry):
- In process, only on that evaluation's own thread. A future, a quiet evaluation (completion, a plugin's) and the window's own thread run on, since pausing the window's thread would freeze it.
- In the Jolt child, on any of its threads while it runs, since that is how the pause reaches the window. A thread still paused when the evaluation ends is let go, because the window can't reach it after that.
Toggling before the Jolt child is running (or right after a switch to it) keeps the dot: the first evaluation sent to the child arms the breakpoints. If that child can't (its Jolt has no jolt.debug), every dot goes and the status bar says why.
Stepping
Paused at a breakpoint, three steps run on and pause again. Each has a key, a palette entry and a button beside Continue in the Frames panel:
| Step | Key | Palette | Pauses at |
|---|---|---|---|
| Step Into | F7 | Step to the next line | the next line reached, inside a call too |
| Step Over | F10 | Step over the next line | the next line in this function or a caller, running a call on this line through |
| Step Out | Shift+F7 | Step out of this function | the caller's next line, once this function has returned |
The keys follow VS Code's F10 and F11 with F7 in F11's place, since macOS keeps F11 for Show Desktop. The panel's title reads Stepped to line 3 for all three, and the console says ; Stepped to line 3.. A green arrow in the gutter marks the paused line, in the tab the code came from, and goes away on Continue, Step or Stop. When the tab was edited since its breakpoints were sent, the line may have moved, so there's no arrow and the status bar says so. The keys step only while a breakpoint's pause shows, and pass through otherwise; at a Break on error pause Step does nothing and says that it works at a breakpoint.
Stepping covers the forms that hold a breakpoint. When a top-level form (or a form inside a (comment ...) block) holds a dot, a Run or a toggle sends it with a step point on every other line that can hold a breakpoint, by the same placement rules. A step point pauses only while stepping, which lasts from a Step to the next pause. So:
- Step Into goes to the next line the run reaches in that form, or after a return to the caller's next line when the caller holds a breakpoint too. A call into a form with no breakpoint runs through without pausing, unless its tab is instrumented (below).
- Step Over and Step Out compare how deep the code is: Over pauses at the same depth or above, so a call on the line runs through, and Out pauses only above, once the function returned. Out from the outermost instrumented function runs to the next dot or the end, as Continue. A dot pauses whichever step is running. Step Over at the end of a function that a library loop calls (
mapv,reduce,run!) pauses in that function's next call, since the loop itself has no frame to return to. Chrome's debugger does the same. Use Continue, or Step Out to leave the loop's function. An inlinefnor#(), and afor,lazy-seq,delayorwith-redefsbody inside a defn, run as calls of their own, so Step Over steps over them, as JVM debuggers do. - Continue turns stepping off and runs to the next breakpoint.
- Stop ends the run, as at any pause, and stepping with it.
A form with dots and nobody stepping pauses only at the dots, and its step points cost next to nothing: each checks one flag and goes on, without throwing. A Step belongs to the thread that was paused: another thread reaching a step point meanwhile runs on, so the step lands on the line the paused code reaches next. Break on error never turns stepping on.
To step into functions that hold no dot, run Instrument this tab for stepping from the palette. It sends every top-level form in the tab that only defines code (a defn, a defmethod, a def of a fn) again with step points, so Step Into goes into any of them. Every later Run, Run Form or Run Selection of that tab keeps the step points in. A form with edits that haven't run isn't sent, and the status line counts it. Forms inside a (comment ...) block and forms that do more than define code are never sent. Stop instrumenting this tab sends the same forms again without step points (a dot keeps its own). Clear All Breakpoints and closing the tab end instrumenting too. Nothing is sent until you ask, and a function value made before the command (one a def already holds) keeps no step points.
Restarts
After an evaluation fails, three restarts take it from there, in every dialect, from the palette or from the bar of buttons at the top of the Frames panel:
- Retry the last failed evaluation runs it again the same way: a REPL entry, Run Form or Run Selection sends the same code again, and a Run runs its tab again (its current text, as Run does).
- Edit the last failed evaluation at the prompt puts its code at the console prompt to change before Enter. For a Run it says to edit the file.
- Define the name the last error couldn't resolve, then retry is there when the error was
Unable to resolve symbol: foo. It puts(def foo )and the code at the prompt, with the caret where the value goes; type the value and Enter defines the name and runs the code again, as one entry.
Code you edit or define at the prompt runs in the prompt's namespace, like any REPL entry, which can differ from the buffer namespace a failed Run Form used. A success clears the failure, so a restart always belongs to the error you just saw. Nothing resumes the failed evaluation itself: by the time the console shows the error, the stack has unwound, so there is nothing to abort either.
Keeping every local
Jolt keeps a frame's locals only when the code was compiled with them. Keep every local for the debugger turns Jolt's debug mode on (run it again to turn it off). Code you load or run afterwards keeps all its locals, so Run again, or reload a namespace, after turning it on. Debug mode keeps tail calls only for recur, so very deep recursion that isn't recur can run out of stack while it's on: Jolt then runs out of memory, keeps no frames, and the panel says so. Turn debug mode off and run it again. Without debug mode, a frame shows the locals Jolt happened to keep, and code typed at the prompt shows none.
The panel reads the frames after the error was caught, from the evaluator that ran the code, in process or in the Jolt child. It needs a Jolt with jolt.debug (jolt-lang/jolt#1465); on an older Jolt the panel says "Frames need a Jolt with jolt.debug (newer than this one)." and debug mode stays off.
In a JVM Clojure window the panel lists the last error's frames too, read from its stack trace on your server: each Clojure fn once (the REPL's own frames and Java's left out), and a frame opens its file from the server's classpath, a jar's included. The JVM keeps no locals, so frames have none, and the field and debug mode say they need Jolt. Showing the frames leaves *1, *2, *3 and *e as they were. The other dialects say "The debugger needs Jolt." for now.
This page is docs/guide/help-and-inspector.md in the Jonquil repository.